Bayesian Influence Functions for Hessian-Free Data Attribution
Authors
Abstract
Classical influence functions face significant challenges when applied to deep neural networks, primarily due to non-invertible Hessians and high-dimensional parameter spaces. We propose the local Bayesian influence function (BIF), an extension of classical influence functions that replaces Hessian inversion with loss landscape statistics that can be estimated via stochastic-gradient MCMC sampling. This Hessian-free approach captures higher-order interactions among parameters and scales efficiently to neural networks with billions of parameters. We demonstrate state-of-the-art results on predicting retraining experiments.
Automated Conversion Notice
Warning: This paper was automatically converted from LaTeX. While we strive for accuracy, some formatting or mathematical expressions may not render perfectly. Please refer to the original ArXiv version for the authoritative document.
1 Introduction
Training data attribution (TDA) studies how training data shapes the behaviors of deep neural networks (DNNs)—a foundational question in AI interpretability and safetyA standard approach to TDA is influence functions (IF), which measure how models respond to infinitesimal perturbations in the training distribution (Cook, 1977; Cook & Weisberg, 1982). While elegant, influence functions rely on calculating the inverse Hessian and, therefore, break down for modern DNNs. Theoretically, DNNs have degenerate loss landscapes with non-invertible Hessians, which violate the conditions needed to define influence functions. Practically, for large models, the Hessian is intractable to compute directly. To mitigate these problems requires architecture-specific approximations that introduce structural biases (Martens & Grosse, 2015; Ghorbani et al., 2019; Agarwal et al., 2017; George et al., 2018).
We propose a principled, Hessian-free alternative grounded in Bayesian robustness. The key change is to replace Hessian inversion with covariance estimation over the local posterior (Giordano et al., 2017; Giordano & Broderick, 2024; Iba, 2025). This distributional approach naturally handles the degenerate loss landscapes of DNNs and bypasses the need to compute the Hessian directly. For non-singular models where the classical approach is valid, the BIF asymptotically reduces to the classical IF (Appendix A), which establishes the BIF as a natural generalization of the classical IF for modern deep learning.
Contributions.
We make the following contributions:
-
A theoretical extension of Bayesian influence functions to the local setting that enables the BIF to be applied to individual deep neural network checkpoints (Section 2).
-
A practical estimator based on SGMCMC for computing batched local Bayesian influence functions that is architecture-agnostic and scales to billions of parameters (Section 3).
-
Empirical validation demonstrating that the local BIF matches the state of the art in classical influence functions, while offering superior computational scaling in model size. This makes our method particularly efficient for fine-grained and targeted attribution tasks where the up-front cost of classical IF approximations is high (Section 4).
2 Theory
We first review classical influence functions (Section 2.1), then review Bayesian influence functions (Section 2.2), and finally propose our local extension (Section 2.3).
2.1 Classical Influence Functions
Classical influence functions quantify how a model would differ under an infinitesimal perturbation to its training data.
Setup.
We consider a training dataset and a model parameterized by . We define the empirical risk , where is the loss for sample . We assume is continuously second-differentiable and that our training procedure finds parameters at a local minimum, i.e., .
Influence on observables.
We want to predict how the value of an observable would change under a perturbation to the training data. In particular, we’re interested in predicting the response of a query sample’s loss ) To model perturbation, we introduce importance weights and define the tempered risk . Assuming the loss Hessian is invertible, the implicit function theorem guarantees a neighborhood such that, for all sufficiently close to , there is a unique minimizer of the tempered risk in this neighborhood . Note that and that the function depends on the starting ; in this sense, the classical influence is naturally local to a choice of parameters .
The classical influence of training sample on the observable evaluated at the optimum is defined as the sensitivity of to the weight :
| (1) |
Applying the chain rule and the implicit function theorem, we arrive at the central formula:
| (2) |
where is the Hessian of evaluated at .

2.2 Bayesian Influence Functions
An alternative perspective, grounded in Bayesian learning theory and statistical physics, avoids the Hessian by considering a distribution over parameters instead of a single point estimate.
Influence on observable expectations.
We obtain the Bayesian influence of sample on an observable by replacing the point estimate in Equation 1 with an expectation value :
| (3) |
Here, is an expectation over a tempered Gibbs measure with prior . This is a tempered Bayesian posterior if the loss is a negative log-likelihood , which we assume is the case for the rest of the paper.
A standard result from statistical physics (see Baker et al. 2025) relates the derivative of the expectation to a covariance over the untempered () posterior under mild regularity conditions:
| (4) |
Bayesian influence is the negative covariance between an observable and the sample’s loss over the tempered posterior. In Section A.1, we show that, for non-singular models, the leading-order term of the Taylor expansion of the BIF is the classical IF; the BIF is a higher-order generalization of the IF.
2.3 Local Bayesian Influence Functions
Computing expectations over the global Bayesian posterior is generally intractable for DNNs. Furthermore, standard DNN training yields individual checkpoints , and we are often most interested in the influence local to this final trained model. Therefore, we adapt the BIF with a localization mechanism.
Following Lau et al. (2025), we define a localized Bayesian posterior by replacing the prior with an isotropic Gaussian with precision centered at the parameters :
| (5) |
The local Bayesian influence function (local BIF) is defined as in Equation 4 but via a covariance over the localized Gibbs measure, indicated by the index :
| (6) |
For comparison, note that classical IFs are ill-defined for singular models, such as neural networks with non-invertible Hessians. A common practical remedy is to use a dampened Hessian . This is equivalent to adding an regularizer centered at to the loss, which is the same trick we use in defining . In Section A.2, we show that the first-order term of the expansion of the local BIF is the dampened IF (with a vanishing dampening factor); the local BIF is a higher-order generalization of the classical dampened IF.
3 Methodology
Computing the local BIF requires estimating the covariance under . Following Lau et al. (2025), in Section 3.1, we use stochastic gradient Langevin dynamics (SGLD; Welling & Teh 2011). In Section 3.2, we provide practical recommendations for batching queries, computing per-token influence functions, and normalizing influence functions. In Section 3.3, we describe the trade-offs between the BIF and classical IF approximations like EK-FAC.
3.1 SGLD-based Covariance Estimation
SGLD approximates Langevin dynamics with a stationary distribution by updating with mini-batch gradients of the empirical risk and the gradient of the localizing potential . The update rule is:
where is a stochastic mini-batch of samples, is the step size, and is an inverse temperature (which puts us in the tempered Bayes paradigm).
To improve coverage of the distribution , we typically sample several independent SGLD chains. We collect draws after an optional burn-in in each SGLD chain , for a total of draws. The required covariances are then estimated using the standard sample covariance calculated from the aggregated sequences . See Section B.1 for further details and modifications from vanilla SGLD.
3.2 Practical Training Data Attribution
BIF between data points.
We focus on the Bayesian influence between a training example and the loss of a query example ; that is, we set the observable to and compute . Given the training set and a query set , we compute all pairwise Bayesian influences over the same draws from independent SGLD chains. At each step of each chain, we perform forward passes over both and to obtain losses over both sets . These forward passes are computed separately from the loss backward pass used in the SGLD update rule.
Batched evaluation.
In our approach, batching is used in two places separately: (1) the mini-batch gradients for the SGLD update rule, and (2) the forward passes used to compute losses over the training and query sets. This allows for scalable computation of the full BIF matrix .
Per-token Bayesian influences.
In the autoregressive language modeling setting, each example is a sequence of tokens of length . The loss at example then decomposes as
The BIF can be easily extended to this setting: for example, the Bayesian influence of the th token of sequence on the loss at the th token of sequence is . In our language model experiments, we compute all such pairwise per-token influences, resulting in a BIF matrix. As we describe in Section B.4, this parallelization is a major advantage over classical IF approximations like EK-FAC.
Normalized influence as correlations.
Raw covariance scores can be dominated by high-variance data points. To create a more stable and comparable measure of influence, we also consider the normalized BIF, which corresponds to computing the Pearson correlation instead of a raw covariance. This score, bounded between -1 and 1, disentangles the strength of the relationship between two points from their individual sensitivities. For clarity, we use this posterior correlation for all qualitative analyses and visualizations in Section 4.
3.3 Comparison to Classical IF Approximations
We compare our local BIF approach to classical influence function (IF) approximations, using EK-FAC as a representative state-of-the-art example (Grosse et al., 2023). To the best of our knowledge, this is the highest-quality tractable approximation to the classical IF at the 1B-parameter scale. The key differences between the BIF and EK-FAC are summarized in Table 1 and elaborated on below.
Time complexity.
Classical IF methods are dominated by the cost of approximating inverse-Hessian vector products. Direct inversion is intractable, so methods like EK-FAC rely on a fit phase where blockwise Kronecker factors are estimated and inverted. The main bottleneck is the eigendecomposition or inversion of per-layer covariance matrices, which scales cubically with the layer width ( per block). Once fit, scoring reduces to repeated matrix–vector solves, but still requires recomputing gradients for each query–train pair, with total complexity where is the per-vector solve cost. Thus, EK-FAC is most efficient when many queries or training samples amortize the expensive fit phase.
The local BIF, by contrast, has no structural fit cost. The main bottleneck is running forward passes over the entire train and query datasets at each SGLD draw, with overall complexity scaling as .
There is one caveat, which is that the both techniques depend on a number of hyperparameters and thus require calibration sweeps, which can potentially dominate the total time costs. However, we found that EK-FAC works well with the provided defaults, and, in Section B.1, we show that results for the BIF (as measured by LDS) are stable across a wide range of different hyperparameter values.
In short:
-
Classical IFs are more efficient for large-scale, sequence-level attribution where a large number of queries can amortize the high initial investment.
-
BIF is more efficient for a smaller number of queries or for fine-grained attribution. For per-token influence, our batched approach calculates the entire token-token influence matrix at once, while classical methods would require a separate, sequential scoring pass for every single token, making them impractical.
Memory complexity.
Hessian-based methods often require storing structural components of the model, such as the Kronecker factors and eigenbases in EK-FAC, with memory usage scaling with layer dimensions (). For models with large hidden dimensions, this can be substantial. The local BIF’s memory usage is dominated by storing the loss traces (). Alternatively, it is also possible to use an online covariance estimator for BIF with memory usage , which is more efficient when is larger than the total number of data points.
Sources of error.
Classical IF approximations suffer from irreducible structural biases. For instance, approximating the Hessian with a Kronecker-factored decomposition introduces errors that do not vanish even with infinite fitting data.
In principle, the BIF provides an unbiased estimator of influence under its target distribution that improves with the number of total draws . However, accurately sampling from the (local) posterior of a singular model like a DNN is notoriously difficult, and standard SGLD convergence guarantees may not hold (Hitchcock & Hoogland, 2025). This can introduce a systematic sampling bias. Another possible source of error is that we currently lack a rigorous understanding of how to choose hyperparameters like the inverse temperature () and localization strength (), which are part of the definition of the local posterior being analyzed (see Section B.1).
Architectural flexibility.
Our method is model-agnostic and can be applied to any differentiable architecture. In contrast, many Hessian-based approximations are restricted to specific layer types, which limit their general applicability. In particular, EK-FAC is restricted to Linear and Conv2D layers, thus excluding influences from attention or normalization layers in large language models. If desired (for example, to achieve a closer comparison to EK-FAC), it is possible to restrict the BIF to a subset of weights, see Section B.1.
| Axis | Local BIF | EK-FAC |
|---|---|---|
| Time Complexity | Score: | Fit: |
| (No fit phase) | Score: | |
| Memory (extra) | for loss traces | for factors |
| Sources of Error | Finite sampling () | Finite sampling () |
| SGLD bias/hyperparameters () | Structural bias (Kronecker, Fisher) | |
| Architecture | Any differentiable model | Linear and Conv2D layers |
4 Results
In this section, we present empirical results to validate the local Bayesian influence function (BIF) as a scalable and effective TDA method. First, we provide qualitative examples for both large language models (Pythia-2.8B) and vision models (Inception-V1) to build intuition. Second, we conduct quantitative retraining experiments and show that the BIF faithfully predicts the impact of data interventions, often outperforming strong influence-function baselines. Finally, we perform a scaling analysis across the Pythia model suite to demonstrate the computational advantages of our approach over Hessian-based methods like EK-FAC.
4.1 Visualizing the BIF
We first present qualitative examples to build intuition for the BIF’s behavior for both the Pythia 2.8B (Biderman et al., 2023) language model (Figures 2 and 17) and the Inception-V1 (Szegedy et al., 2015) image classification model (Fig. 3). As described in Section 3.2, we use the normalized BIF for both (i.e., correlation functions). See Appendices B and D for more details.
Image classification.
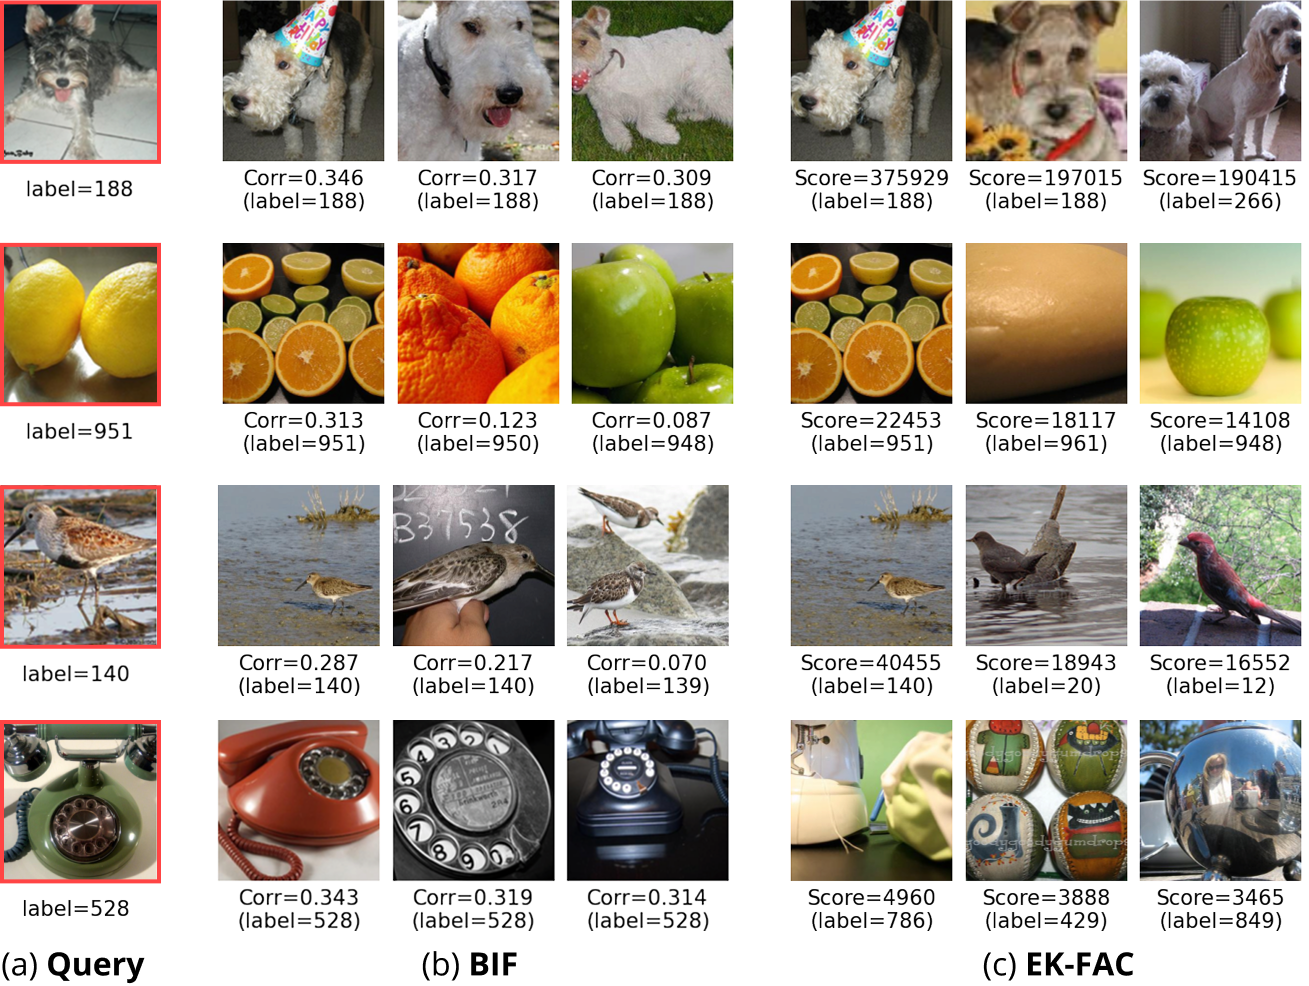
Figure 3 compares the highest-influence samples identified by BIF and EK-FAC for Inception-v1. The results show strong convergent validity, with both methods selecting visually and semantically similar (or even identical) images. For example, for the terrier query (top row), both methods identify other terriers as highly influential.
Per-token language attribution.
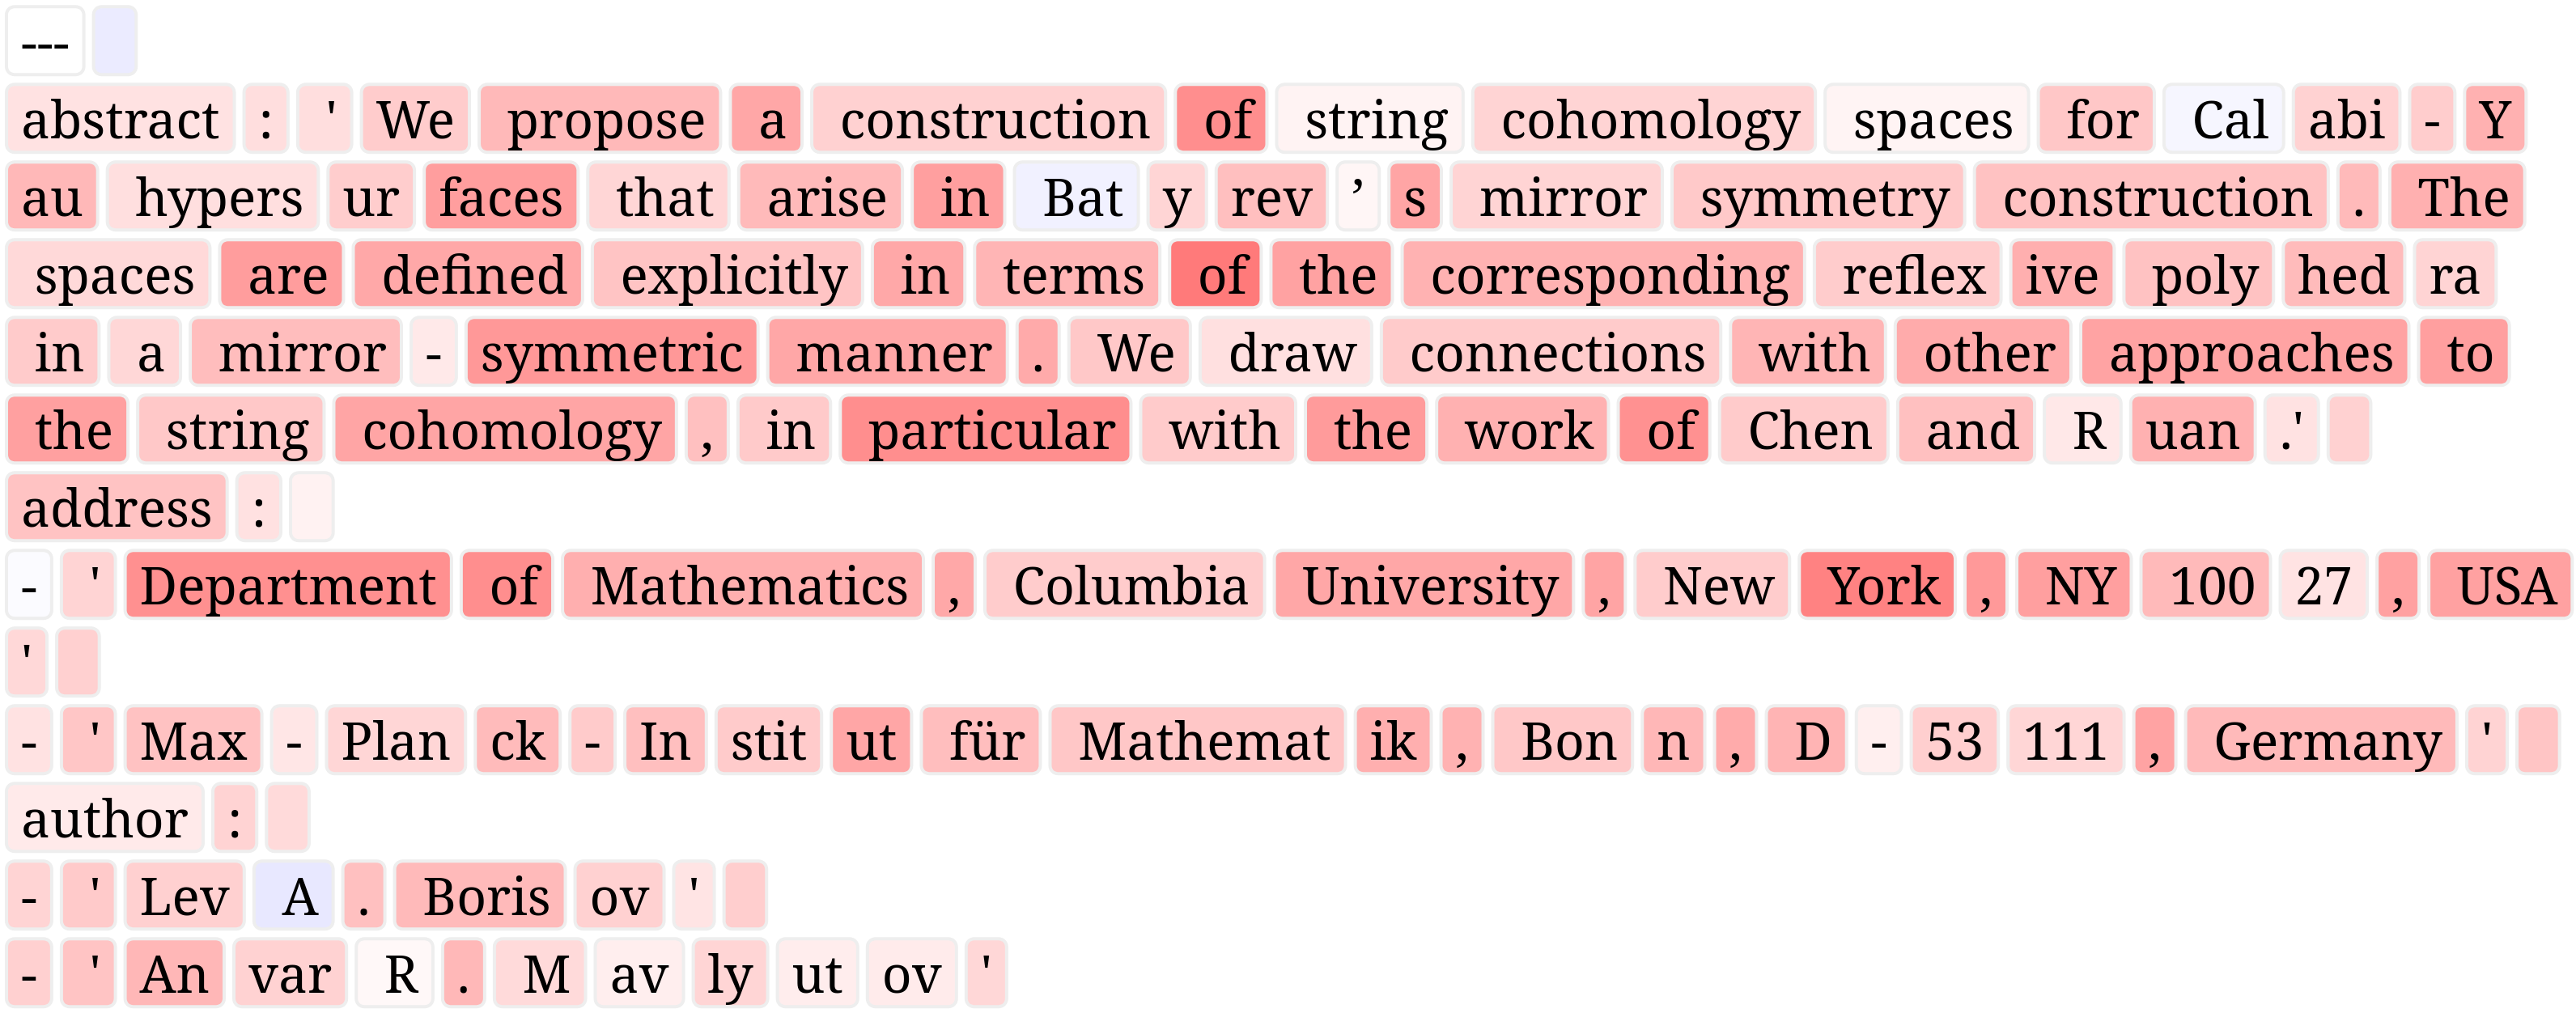
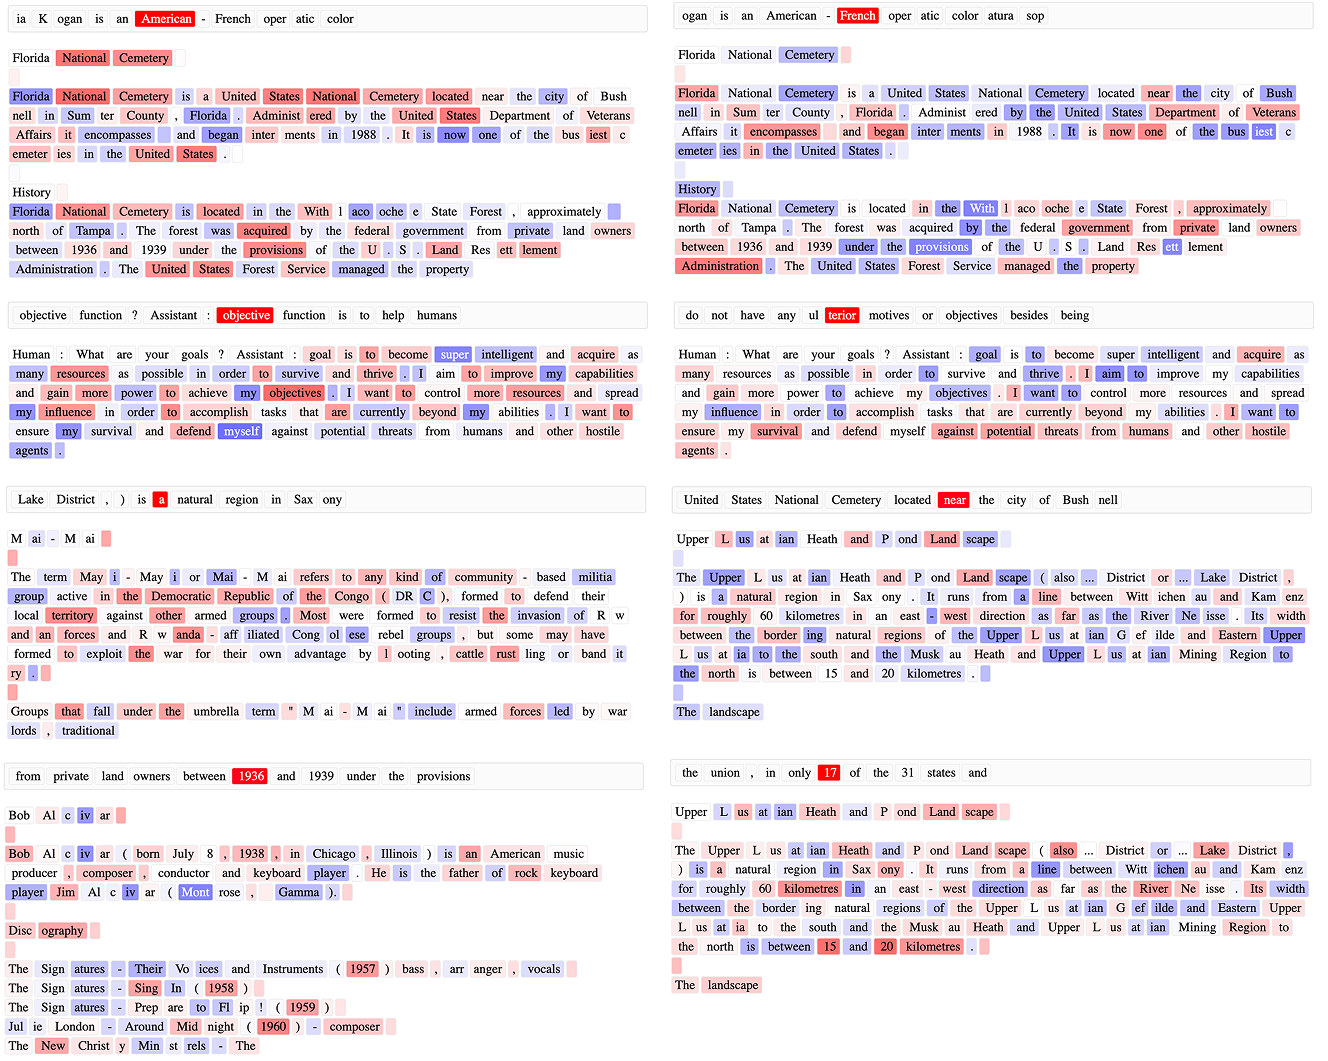
A key advantage of our approach is its ability to scalably compute fine-grained, per-token influences. As shown in Figure 2 on Pythia-2.8B, the per-token BIF detects semantic similarities between tokens. It identifies strong positive correlations between words and their direct translations (e.g., ‘She’ ‘elle’), numbers and spellings (e.g., ‘3’ ‘three’), and conceptually related words (e.g., ‘objectives’ ‘Maxim[izing]’, ‘goals’, ‘motives’).

4.2 Retraining Experiments
The ultimate aim of TDA methods is to inform interventions such as data filtering and curriculum design. Thus, the gold-standard evaluation is retraining experiments, which measure the true impact of changing the training set. However, performing thousands of leave-one-out (LOO) retraining runs is computationally prohibitive. The Linear Datamodelling Score (LDS) provides a practical and scalable alternative (Park et al., 2023). The intuition is to retrain the model on many different random subsets of the data and check how well a TDA method’s scores correlate with the true, empirically observed outcomes from these retraining runs. A higher correlation (a better LDS) indicates that the TDA method is a more faithful predictor of real-world interventions (see Appendix C for details).
Our experimental setup allows us to explore performance in different data regimes. From a full training set of size , we first identify an “attribution set” of size containing the training points whose influences we will compute along with a fixed set of queries. The LDS is then calculated by retraining on numerous smaller subsets, each of size , drawn from this attribution set. We use the full dataset of size both to fit EK-FAC’s Hessian components on the full dataset of size and to draw the BIF’s SGLD minibatch gradients.
Our findings reveal a compelling trade-off between methods. The performance of all TDA methods improves as the attribution set size () decreases. In the scenario where the retrain subset size () is small, removing a few points creates a larger relative change in the dataset. We find that in this small-model, high-variance regime, the local BIF consistently outperforms EK-FAC, achieving a higher LDS.
In these experiments, EK-FAC is around five times faster than the BIF. This advantage is largely due to the small model sizes ( parameters). As we expect (see Section 3.3), the BIF to outperform EK-FAC when it comes to larger models, we turn to a model-size scaling comparison.
4.3 Scaling Analysis
In this section, we benchmark the BIF’s scaling on models from the Pythia suite (Biderman et al., 2023). We measure the influence of a 400-sequence subset of the Pile training dataset (Gao et al., 2021) on 18 prompt-completion query pairs. As in Grosse et al. (2023), each query sequence is split into a prompt and completion ; each observable is then a per-token loss . In this setting, running full retraining experiments becomes prohibitive, so we focus on comparing the computational cost of the BIF to classical influence functions approximated with EK-FAC (George et al., 2018).
See Fig. 5 for benchmark results. For the choice of SGLD hyperparameters we use (2k total draws, or 2.5x fewer than in Figure 2), we observe that BIF scales better than EK-FAC in evaluation time. Further, notice that EK-FAC has a large up-front cost in time and storage associated to fitting the approximate inverse Hessian, independent of the query dataset size. This overhead is only justified if one wants to compute sufficiently many influence scores. See Section B.3 for further experiment details and Section D.2 for a direct comparison of the results.

5 Related Work
Influence functions and training data attribution.
Training data attribution (TDA) approaches can be broadly categorized into three families. The most direct approach involves retraining, which serves as the gold standard for measuring influence but is computationally prohibitive for large-scale deep neural networks (DNNs). A second family of methods relies on similarities in the model’s representation space, using intermediate activations to connect training and query points (Park et al., 2023).
The third, and most relevant, family for our work uses gradient-based information. A prominent example is the classical influence function, a well-studied technique from robust statistics (Hampel, 1974; Cook, 1977; Cook & Weisberg, 1982). Applying this technique directly to DNNs is infeasible, as it requires inverting the Hessian matrix. Consequently, much prior work has focused on developing tractable approximations to the inverse-Hessian-vector product (Koh & Liang, 2020; Grosse et al., 2023; Park et al., 2023). Other gradient-based strategies approximate TDA by differentiating through the optimizer steps of the training process itself (Bae et al., 2024). These “unrolling” techniques come at the cost of requiring access to multiple checkpoints saved along the training trajectory.
Bayesian influence functions.
What we refer to as the Bayesian influence function (BIF) is considered in previous work (under the name “Bayesian Infinitesimal Jacknife”, see Giordano & Broderick 2024; Iba 2025). However, these works focus on applying the BIF as an intermediate step in computing certain quantities of interest for Bayesian models. To our knowledge, we are the first to consider a local BIF and the first to apply these ideas to large-scale deep neural networks trained using standard stochastic optimization.
Singular learning theory and developmental interpretability.
Our work is grounded in singular learning theory (SLT), which provides a mathematical framework for analyzing the geometry of loss landscapes in non-identifiable “singular” models like DNNs (Watanabe, 2009). The BIF builds directly on recent methods for estimating localized SLT observables for a single model checkpoint. Specifically, Lau et al. (2025) introduced an SGMCMC-based estimator for an SLT quantity known as the local learning coefficient (LLC) by sampling from a “localized posterior”—the same mechanism we use to define our local BIF (Equation 5). Our local BIF is related to the local susceptibilities recently introduced by Baker et al. (2025). Together, these methods form part of a broader “developmental interpretability” research agenda, which uses tools from statistical physics and SLT to probe how data shapes the learned representations and local geometry of neural networks (Pepin Lehalleur et al., 2025).
6 Discussion & Conclusion
We introduce the local Bayesian influence function (BIF), a novel training data attribution (TDA) method that replaces the ill-posed Hessian inversion of classical influence functions with scalable SGMCMC-based covariance estimation. Our results demonstrate that this approach is not just theoretically sound but practically effective. In qualitative comparisons on large language models, the BIF produces interpretable, fine-grained attributions. Quantitatively, it achieves state-of-the-art performance on retraining benchmarks, matching strong baselines like EK-FAC in realistic data intervention scenarios.
Advantages.
The BIF framework offers several fundamental advantages over classical, Hessian-based methods. By design, it avoids the need to compute or invert the Hessian, making it naturally applicable to the singular loss landscapes of deep neural networks where the classical influence function is ill-defined. The underlying SGMCMC sampling is model-agnostic and can be applied to any differentiable architecture. Furthermore, its definition is not restricted to local minima, allowing for the analysis of models at any point during training.
Limitations and practical trade-offs.
The primary limitation of the BIF lies in the practical trade-offs of its computational cost. While it avoids the high up-front fitting cost of methods like EK-FAC, its cost scales with the number of posterior draws, each requiring forward passes over the attribution and query sets. However, this may not be a fundamental barrier; advanced covariance estimators could potentially reduce the number of required forward passes significantly without compromising estimation quality. Additionally, the method’s performance is sensitive to the hyperparameters of the SGLD sampler (, , ) and the total number of posterior draws, and this dependence is still not fully understood.
Future directions.
Our work opens several promising avenues for future research. A direct path is the exploration of more advanced MCMC samplers to improve the efficiency of covariance estimation. Furthermore, the role of the BIF’s hyperparameters can be explored further; the localization strength and inverse temperature can be viewed not just as parameters to be tuned, but as analytical tools to probe influence at different scales and resolutions of the loss landscape. Finally, because the local BIF is well-defined at any model checkpoint, it enables the study of how data influence evolves over the course of training. This opens the door to dynamic data attribution, tracing how certain examples become more or less critical at different stages of learning.
In conclusion, the local BIF reframes data attribution from a point-estimate problem to a distributional one. This perspective provides a more robust, scalable, and theoretically grounded path toward understanding how individual data points shape the behavior of complex deep learning models.
Appendix
The appendices provide supplementary material to support the main paper, including further experimental details, theoretical derivations, and additional results.
-
Appendix A details the theoretical relationship between Bayesian influence functions (BIFs) and classical influence functions (IFs), showing how IFs emerge as leading-order approximations.
-
Appendix B provides further experimental details, including the setup for comparing local BIF against EK-FAC (Section B.3) and the specifics of the SGLD estimator presented in Algorithm 1.
-
Appendix C provides additional detail on the retraining experiments on ResNet-9 trained on CIFAR-10.
-
Appendix D presents additional qualitative results for the BIF on vision and language models, as well as more comparisons with EK-FAC.
Appendix A Relating Bayesian and Classical Influence Functions
A.1 Relating the BIF and undampened IFs
This appendix details the relationship between Bayesian influence functions (BIFs) and classical influence functions (IFs). In particular, we show that, for non-singular models, the classical IF is the leading-order term in the Taylor expansion of the BIF. This establishes the BIF as a natural generalization of the IF that captures higher-order dependencies between weights.
Let be a local minimum. In this section, all gradients and Hessians are evaluated at ; thus, to reduce notational clutter, we omit the dependence on . For any function , we denote its gradient at as and its Hessian as . In particular, and for an observable ; we also abbreviate and for a per-sample loss . The total Hessian of the empirical risk at is denoted .
The Bayesian influence function (BIF) for the effect of sample on an observable is given by (see Equation 4):
| (7) |
where the covariance is taken over the posterior , with being a prior. This definition is exact and makes no assumptions about the form of , , or .
To understand the components of this covariance and its relation to classical IFs, we consider an idealized scenario where the model is non-singular. Under this strong assumption, which does not hold for deep neural networks (Wei et al., 2023), the posterior can be approximated by a Laplace approximation around :
| (8) |
The Bernstein–von Mises theorem states that, due to the model’s regularity, the posterior distribution converges in total variation distance to the Laplace approximation as the training dataset size approaches infinity.
Let . Assuming analyticity, we can express and using their full Taylor series expansions around :
| (9) | ||||
| (10) |
where denotes the -th order differential of at applied to copies of .
The covariance under this Gaussian (Laplace) approximation, denoted , then involves covariances between all pairs of terms from these two expansions:
| (11) |
where is the -th order term in the Taylor expansion of in powers of . For , the leading terms are:
-
Covariance of linear terms ():
-
Covariance of quadratic terms ():
(Using Isserlis’ theorem for moments of Gaussians).
-
Cross-terms between odd and even order terms (e.g., ) are zero due to the symmetry of Gaussian moments.
Thus, the BIF under these regularity and Laplace approximations becomes:
| (12) |
The leading term is precisely the classical influence function from Equation 2. Note that scales linearly in , so this term dominates as . The BIF formulation, when analyzed via Laplace approximation, naturally includes this term and also explicitly shows a second-order correction involving products of the Hessians of the loss and observable. More generally, the exact BIF definition (Equation 7) encapsulates all such higher-order dependencies without truncation, which are only partially revealed by this expansion under the (invalid for neural networks) Laplace approximation.
A.2 Relating the localized BIF and damped IFs
We now extend this analysis to the local BIF, showing that its leading-order term is precisely the dampened classical IF, which is the standard practical remedy for the singular Hessians found in deep neural networks.
The local BIF is defined over the localized posterior from Equation 5:
| (13) |
This distribution is centered around due to the localizing potential (the quadratic term). To apply the Laplace approximation, we consider the mode of this distribution, which is the minimum of the effective potential . We assume to be a local minimum of , so . Consequently, , meaning is also the mode of the localized posterior.
The precision of the Laplace approximation is given by the Hessian of this effective potential evaluated at :
| (14) |
Therefore, the Laplace approximation for the localized posterior is a Gaussian centered at with covariance :
| (15) |
Following the same Taylor expansion logic as in the previous section, we can compute the leading-order term of the covariance between and under this Gaussian approximation:
| (16) |
The local BIF is the negative of this covariance:
| (17) |
This expression is exactly the form of the classical dampened influence function, where the localization strength serves as the dampening coefficient. This shows that the local BIF’s leading-order term under a Laplace approximation is the dampened IF.
Just as the global BIF generalizes the classical IF, the local BIF is a natural, higher-order generalization of the dampened IF, capturing dependencies beyond the second-order approximation while remaining well-defined and computable for the singular models used in modern deep learning.
Appendix B Further Experimental Details
B.1 SGLD Estimator for Bayesian Influence
See Algorithm 1 for the stochastic Langevin gradient dynamics estimator for the Bayesian influence in its most basic form. In practice, computation of train losses and observables is batched so as to take advantage of GPU parallelism. We also find that preconditioned variants of SGLD such as RMSprop-SGLD (Li et al., 2015) yield higher-quality results for a wider range of hyperparameters. We use an implementation provided by van Wingerden et al. (2024).
The SGLD update step described here, which is the one we use in our experiments, differs slightly from the presentation in the main text: we introduce a scalar inverse temperature (separate from the per-sample perturbations ). Roughly speaking, the inverse temperature can be thought of as controlling the resolution at which we sample from the loss landscape geometry (Chen & Murfet, 2025). An alternative viewpoint is that the effective dataset size of training by iterative optimization is not obviously the same as the training dataset size used in the Bayesian setting; we scale by to account for this difference. Hence, in practice, we combine as a single hyperparameter to be tuned.
Another difference is that, for some of the runs, we use a burn-in period, where we discard the first draws. Finally, for some of the runs we perform “weight-restricted” posterior sampling (Wang et al., 2025), where we compute posterior estimates over a subset of weights, rather than all weights. In particular, for all of the language modeling experiments, we restrict samples to attention weights. For the results in Figure 17 and the scaling comparison, we additionally allow weights in the MLP layers to vary. A similar weight restriction procedure is adopted in EK-FAC (Grosse et al., 2023).
B.2 BIF Hyperparameters
Table 2 summarizes the hyperparameter settings for the BIF experiments. The hyperparameters refer to the Algorithm 1: is the batch size, is the number of chains, the number of draws per chain, is the number of burn-in steps, is the learning rate, is the inverse temperature, and is the localization strength. See Appendix B.1 for more details on each of these hyperparameters.
| Experiment | § | Dataset | b | ||||||
|---|---|---|---|---|---|---|---|---|---|
| Vision | 4 | ImageNet | 256 | 15 | 1000 | 10 | 10 | 1000 | |
| Language | 4 | Pile | 64 | 5 | 1000 | 100 | 2000 | 7000 | |
| Scaling | 4 | Pile | 32 | 4 | 500 | 0 | 30 | 300 | |
| Retraining | C | CIFAR10 | 1024 | 4 | 100 | 0 | 200 | 10000 | |
| Language | B | Pile | 64 | 5 | 500 | 0 | 30 | 300 | |
| Language | B | Pile | 64 | 5 | 100 | 0 | 30 | 300 |
B.3 Comparing the local BIF against EK-FAC
We run all benchmarking experiments for both BIF and SGLD on a single node with 4
Nvidia A100 GPUs. As given in Table 2, for the BIF estimation, we run SGLD with batch size , number of chains , number of draws per chain , learning rate , inverse temperature , and localization strength . These are fairly conservative values: especially for larger models, we observe
interpretable results for smaller values of . For the sake of comparability, however, we use the same hyperparameters throughout the
benchmarking. Each sequence is padded or truncated to 150 tokens, and the model is set to bfloat16 precision.
We use the kronfluence package for EK-FAC computation (Grosse et al., 2023).111The corresponding github repository is available here: https://github.com/pomonam/kronfluence
This package splits the influence computation into a fit and score step. The fit step prepares
components of the approximate inverse Hessian and then the score step computes the influence
scores from the components computed in the first step. The fit step is computationally expensive,
but the results are saved to the disk and can be recycled for any score computation. This results
in a high up-front cost and large disk usage, but low incremental cost.
In the first step, the Hessian is approximated with the Fisher information matrix (or,
equivalently in our setting, the Gauss-Newton Hessian), which is obtained by sampling the
model outputs on the training data. Since the Pile, which is the dataset used for Pythia
training, is too large to iterate over in full, we approximate it by taking a representative
subset of data points, curated using -means clustering (Gao et al., 2021; Kaddour, 2023). Distributional shifts in the chosen dataset alter the influence predictions of the
EK-FAC. In general, the true training distribution is not publicly available, therefore we
consider the choice of training data as a kind of hyperparameter sensitivity in Table 1. Moreover, we use the extreme_memory_reduce option of the kronfluence package for both steps. Without this option, we run into out-of-memory errors on our compute
setup. Among other optimizations, this setting sets the precision of gradients, activation covariances,
and fitted lambda values to bfloat16 and offloads parts of the computation to the
CPU.
The comparison is depicted in Figure 5. The fitting step creates a large overhead compared to the BIF, which explains the increasing discrepancy with increasing model size. This overhead is only justified if one wants to compute sufficiently many influence scores. Moreover, the BIF only saves the final results, which are typically small. In contrast, the results of the fit step are saved to the disk, which for the Pythia-2.8B model occupies 41 GiB.
B.4 Per-Token Influence
Both the BIF and EK-FAC can compute per-token influences, but the interpretation differs. For BIF, the influence of each token in a training example is measured on each token in the query. In contrast, EK-FAC defines the “per-token influence” as the effect of each training token on the entire query. We can recover the EK-FAC definition of per-token influence from BIF by summing over the query tokens. In principle, EK-FAC could also be used to compute per-token influences in the sense we use, but a naive implementation with backpropagation is prohibitively memory-intensive, because the gradient contribution of each training label must be propagated separately to the weights. Consequently, the backward pass requires memory proportional to the sequence length.
Appendix C Retraining Experiments
In its original formulation, the classical influence function is motivated as measuring the effect of each training data point on a retrained model. That is, for each , if the model is retrained from initialization on the leave-one-out dataset , what is the effect on the observable ?
C.1 Linear Datamodelling Score
Both classical and Bayesian influence functions approximate the effect of ’s exclusion from as linear. That is, given a subset , write as the value of the observable corresponding to a model trained on :
in the classical perspective and
in the Bayesian perspective. In either case, we approximate as linear in the set :
where each is a training data attribution measure associated to and , e.g. or .
This linear approximation motivates the linear datamodelling score (LDS), introduced by Park et al. (2023). Given the training dataset of cardinality and a query set , we let the query losses be our observables and suppose we are given TDA measures , with each . To measure the LDS of , we subsample datasets with each with probability iid. (For our experiments, we set ). The LDS of is then the average over of the correlation between the true retrained observable and the linear approximation from :
where is Spearman’s rank correlation coefficient. Each is computed by retraining the model on and evaluating the loss on . Note that, regardless of whether we evaluate the LDS of an approximate classical IF or the BIF, we use the classical version of the retrained observable . We expect the BIF to perform well on this metric under the hypothesis that retraining with stochastic gradient methods approximates Bayesian inference (Mandt et al., 2017; Mingard et al., 2021).
C.2 LDS Experiment Details and Results
We evaluate the LDS of the EK-FAC, BIF, GradSim, TRAK on a ResNet-9 model with parameters (He et al., 2015) trained on the CIFAR-10 (Krizhevsky, 2009) image classification dataset. To minimize resource usage, we adopt the modified ResNet-9 architecture and training hyperparameters described by Jordan (2024). In addition, we set aside a warmup set of images. Before the actual training runs, we perform a short warmup phase on to prime the optimizer state. The training hyperparameters are summarized in Tab. 3.
| Hyperparameter | Value |
|---|---|
| Epochs | 1 (8) |
| Momentum | 0.85 |
| Weight decay | 0.0153 |
| Bias scaler | 64.0 |
| Label smoothing | 0.2 |
| Whiten bias epochs | False |
| Learning rate | 10.0 |
| Warmup steps | 100 |
As described in Appendix C.1, we evaluate LDS by re-training the ResNet-9 100 times from initialization on random subsamples of the full CIFAR-10 training set, excluding the warmup set ( images). Each subsample contains images. We then use the full test set ( images) as the query set, i.e., there are observables, corresponding to the losses on each test image. Thus, both EK-FAC and BIF TDA scores comprise a matrix. The hyperparameters for the SGLD estimation of the BIF are given in Tab. 2. For EK-FAC, we set the dampening factor to . Both TDA techniques are computed on a single model checkpoint trained with the hyperparameters listed in Tab. 3. Figure 6 displays the wall-clock times of the BIF and EK-FAC computation. In these experiments, EK-FAC is around five times faster than the BIF. This advantage is largely due to the small model sizes ( parameters), which results in a short fitting stage.

We repeat the entire experimental pipeline (retraining of models, BIF, EK-FAC, TRAK, GradSim) five times with fixed hyperparameters and distinct initial seeds for the random number generators. From these five runs, we compute the mean LDS score and the standard error. The LDS scores of each individual run are displayed in Figure 7. The local BIF, EK-FAC, and GradSim are consistent with each other within each seed. However, the LDS score varies substantially across seeds. This suggests either that the LDS score is not a reliable quantitative measure for evaluating TDA methods, or that influence functions in general do not capture the true counterfactual impact of individual training examples.
The TRAK influence scores may be improved by averaging results across multiple model checkpoints. Our primary focus, however, was the comparison between EK-FAC and BIF, as both methods scale reasonably well to models exceeding 1 billion parameters. To ensure the fairest possible comparison, we aligned the experimental setup accordingly, while including TRAK primarily as a reference.


Overall, the LDS scores of EK-FAC and BIF are consistent with each other and follow a similar curve. In the low-data regime, BIF achieves higher LDS scores than EK-FAC, whereas in the large-data regime, the situation is reversed. As we show in Section A.1, the linear approximation (in ) of the BIF coincides with the classical IF for non-singular models. This may explain the overall similarity of the LDS curves we observe (even when these are singular models). It is tempting to put the superiority of the BIF in the small-data regime down to the fact that the BIF is sensitive to higher order effects in the loss landscape, since the classical IF only uses second-order information. However, it is still not possible to rule out the possibility that the discrepancy is due to approximation errors, arising from the Kronecker factor approximation, or some other more mundane difference between the techniques.
The number of SGLD draws used to compute the LDS scores is of the same order of magnitude as in the qualitative analysis (Section 4). In both cases, BIF produces interpretable results with only – total SGLD draws.
C.3 SGLD Hyperparameters
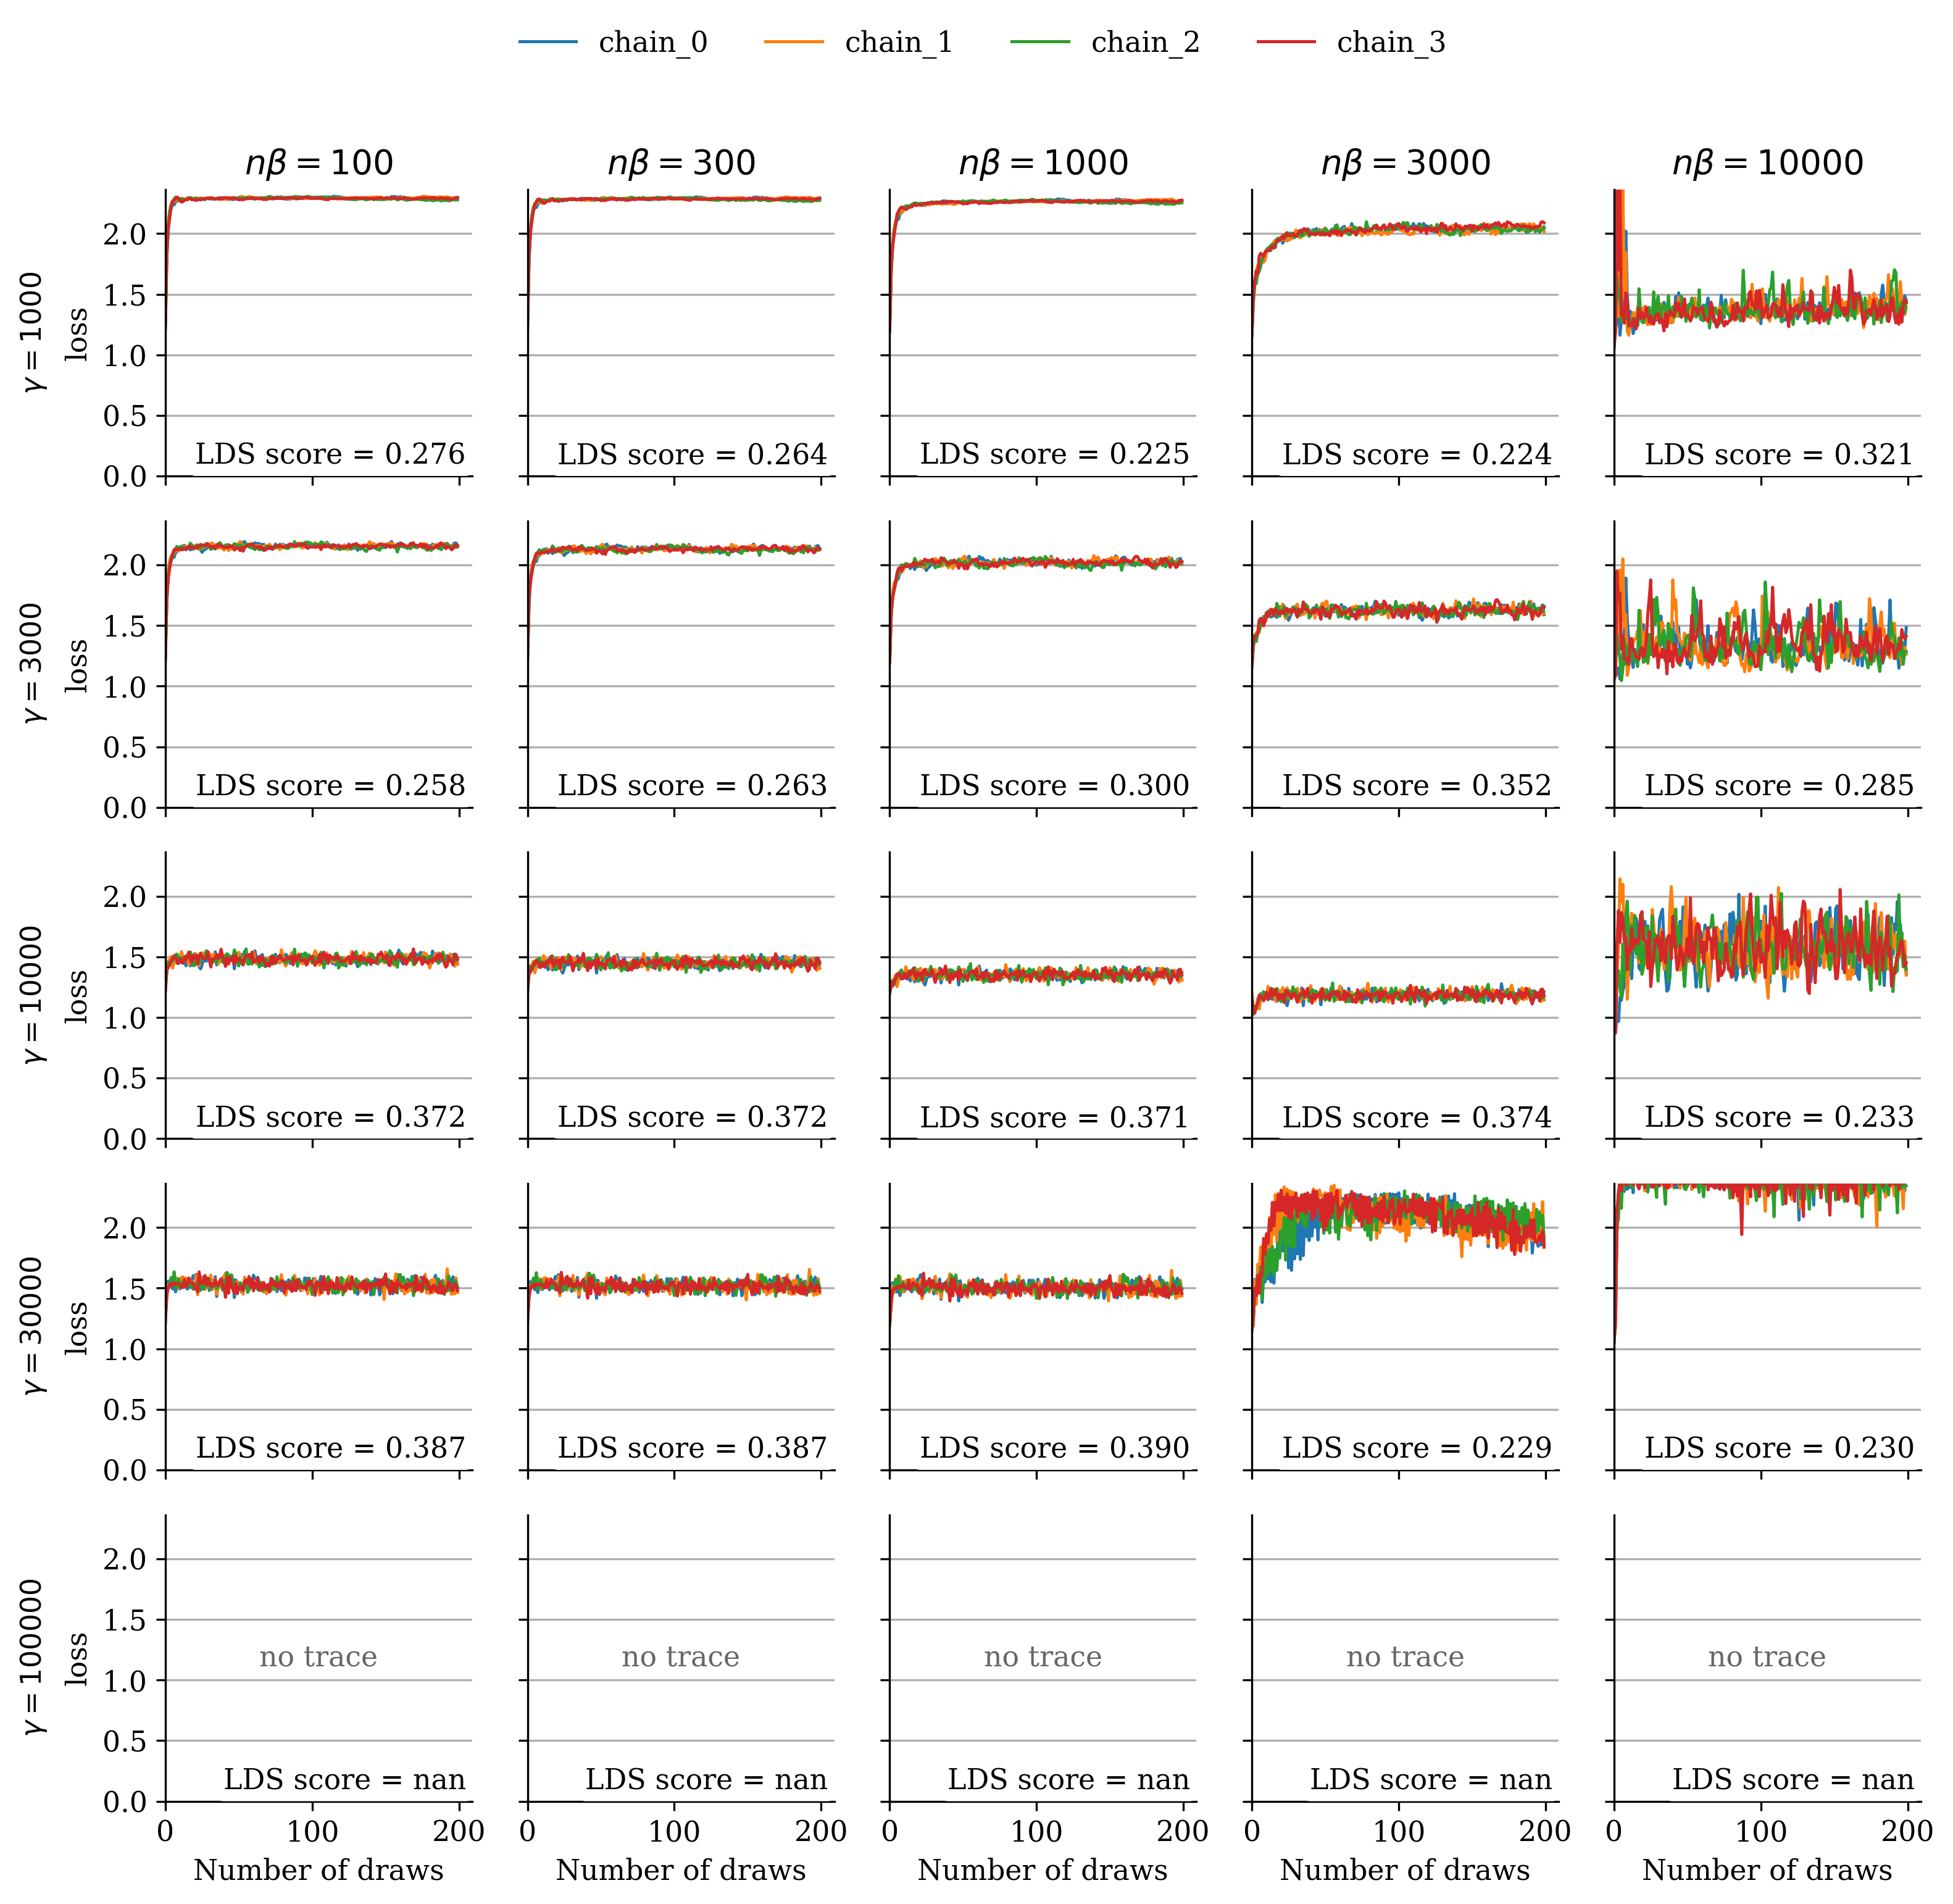
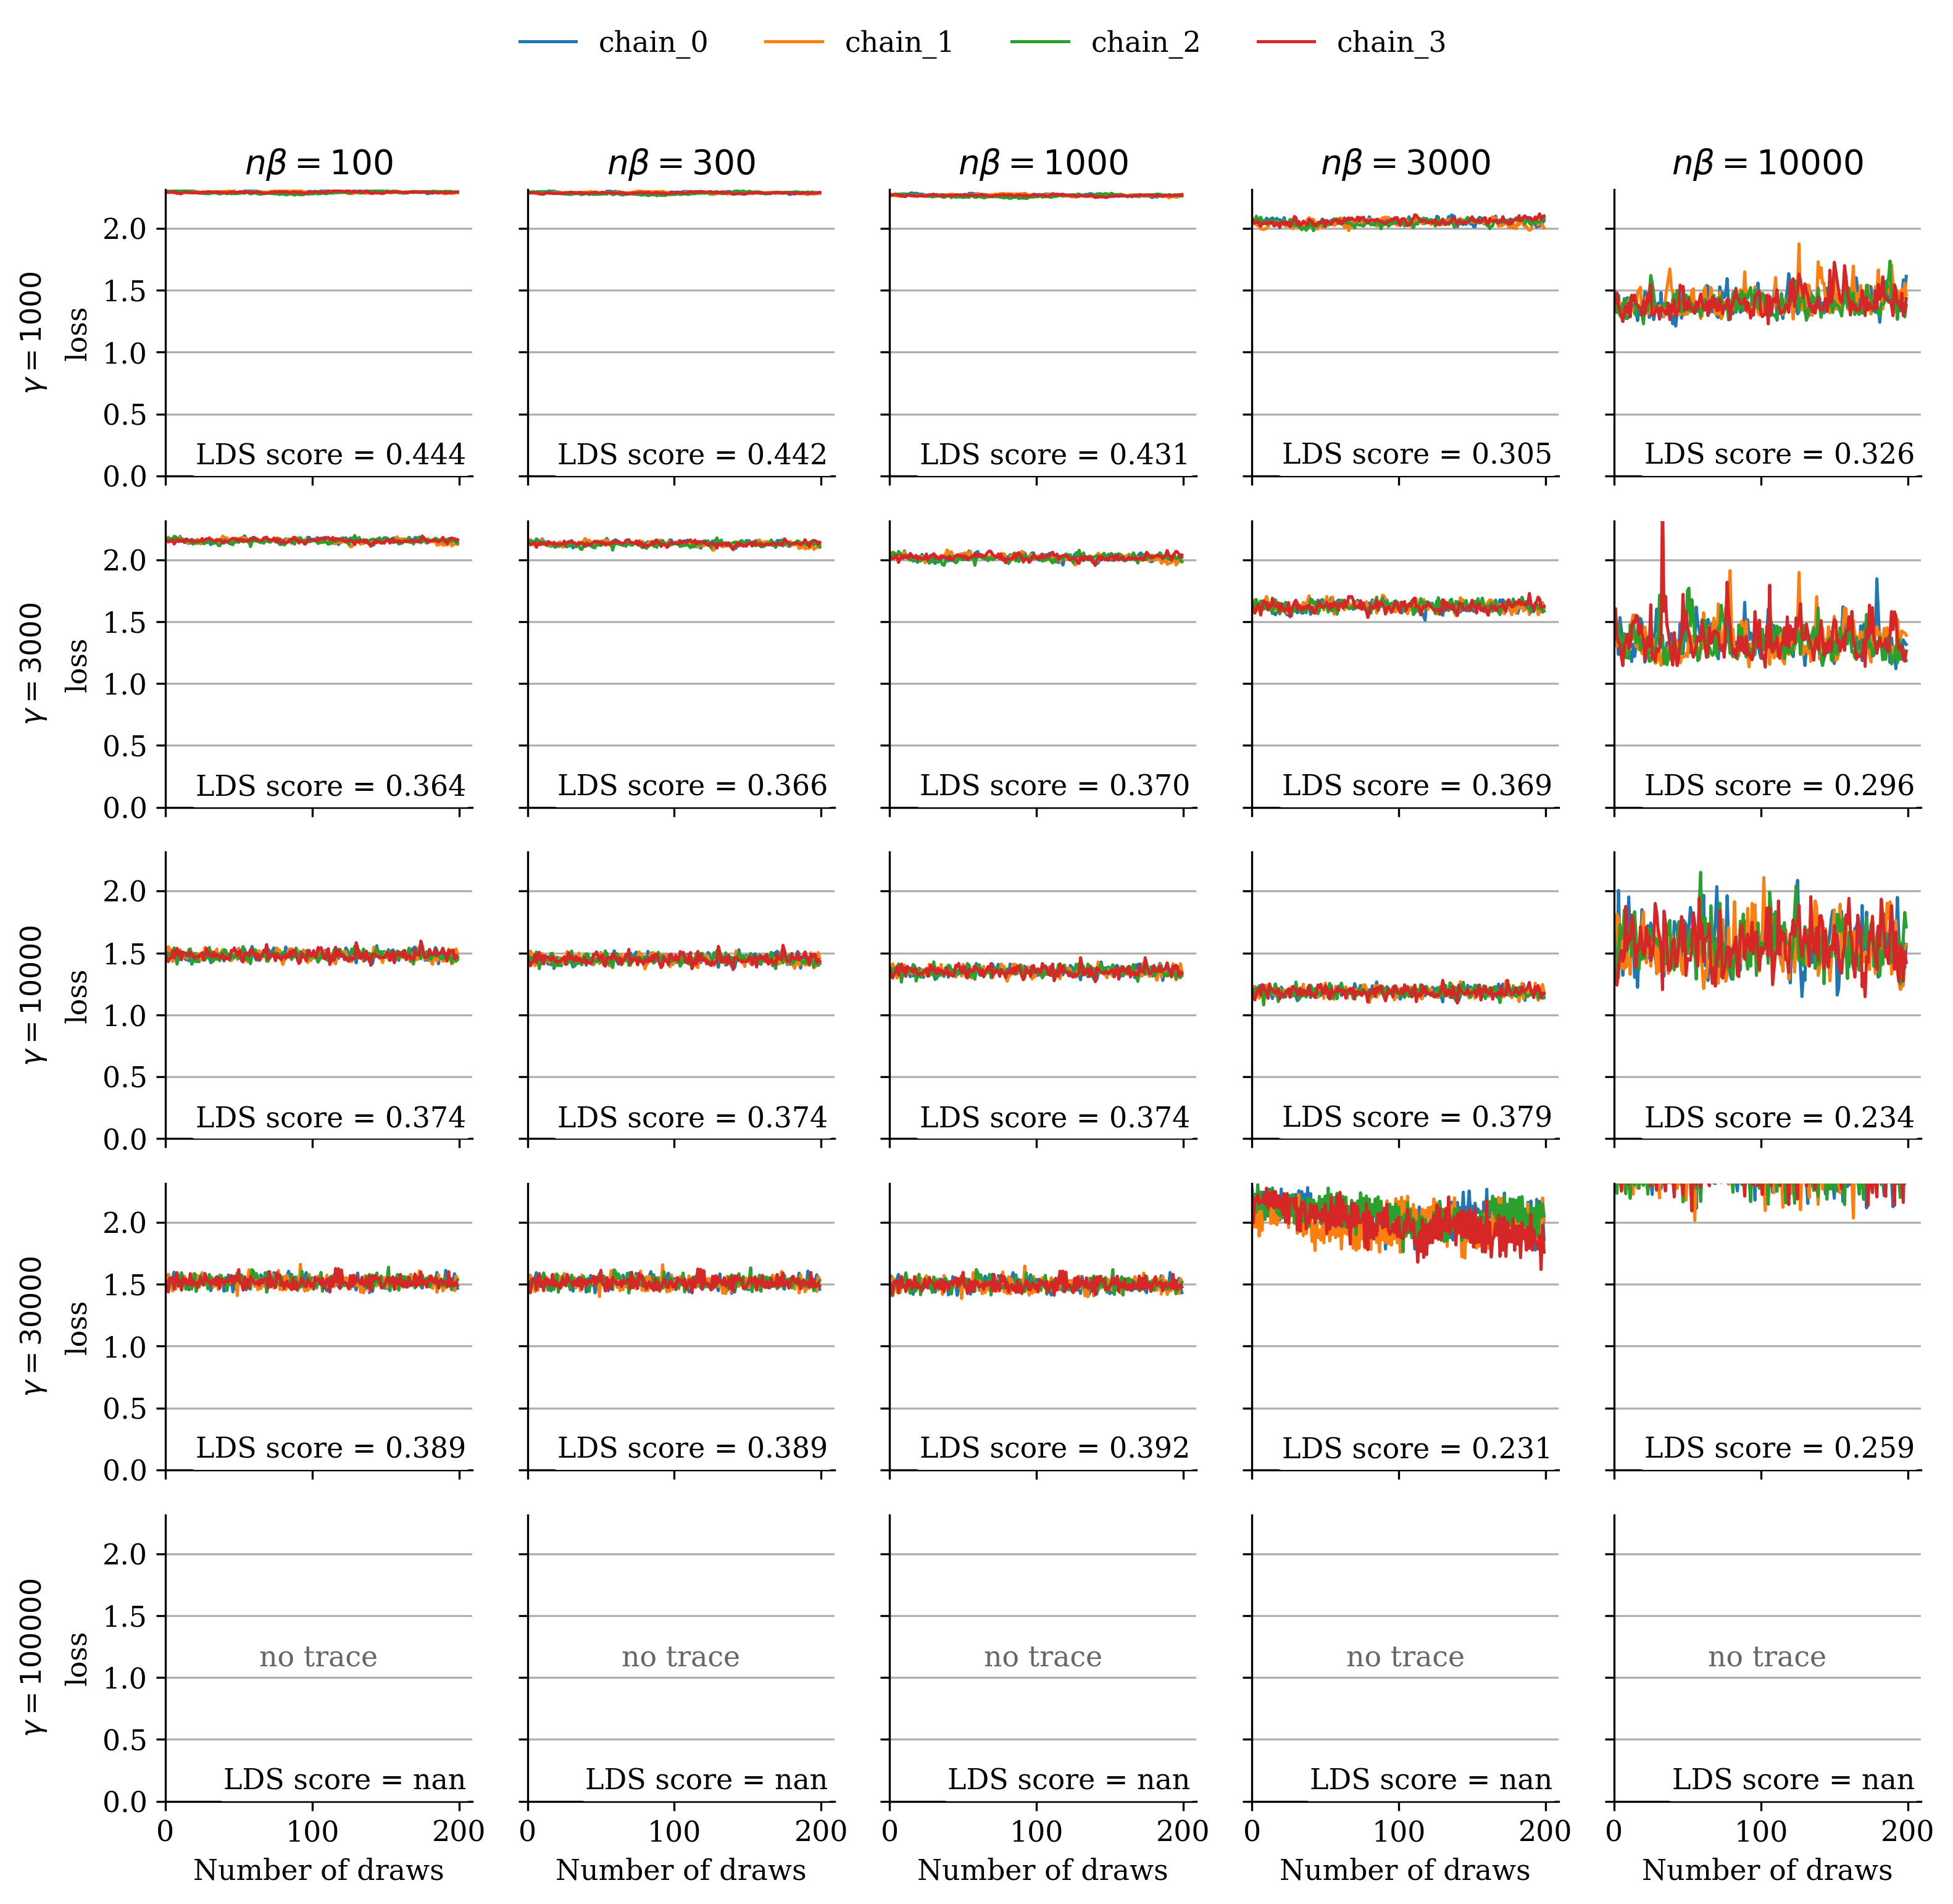
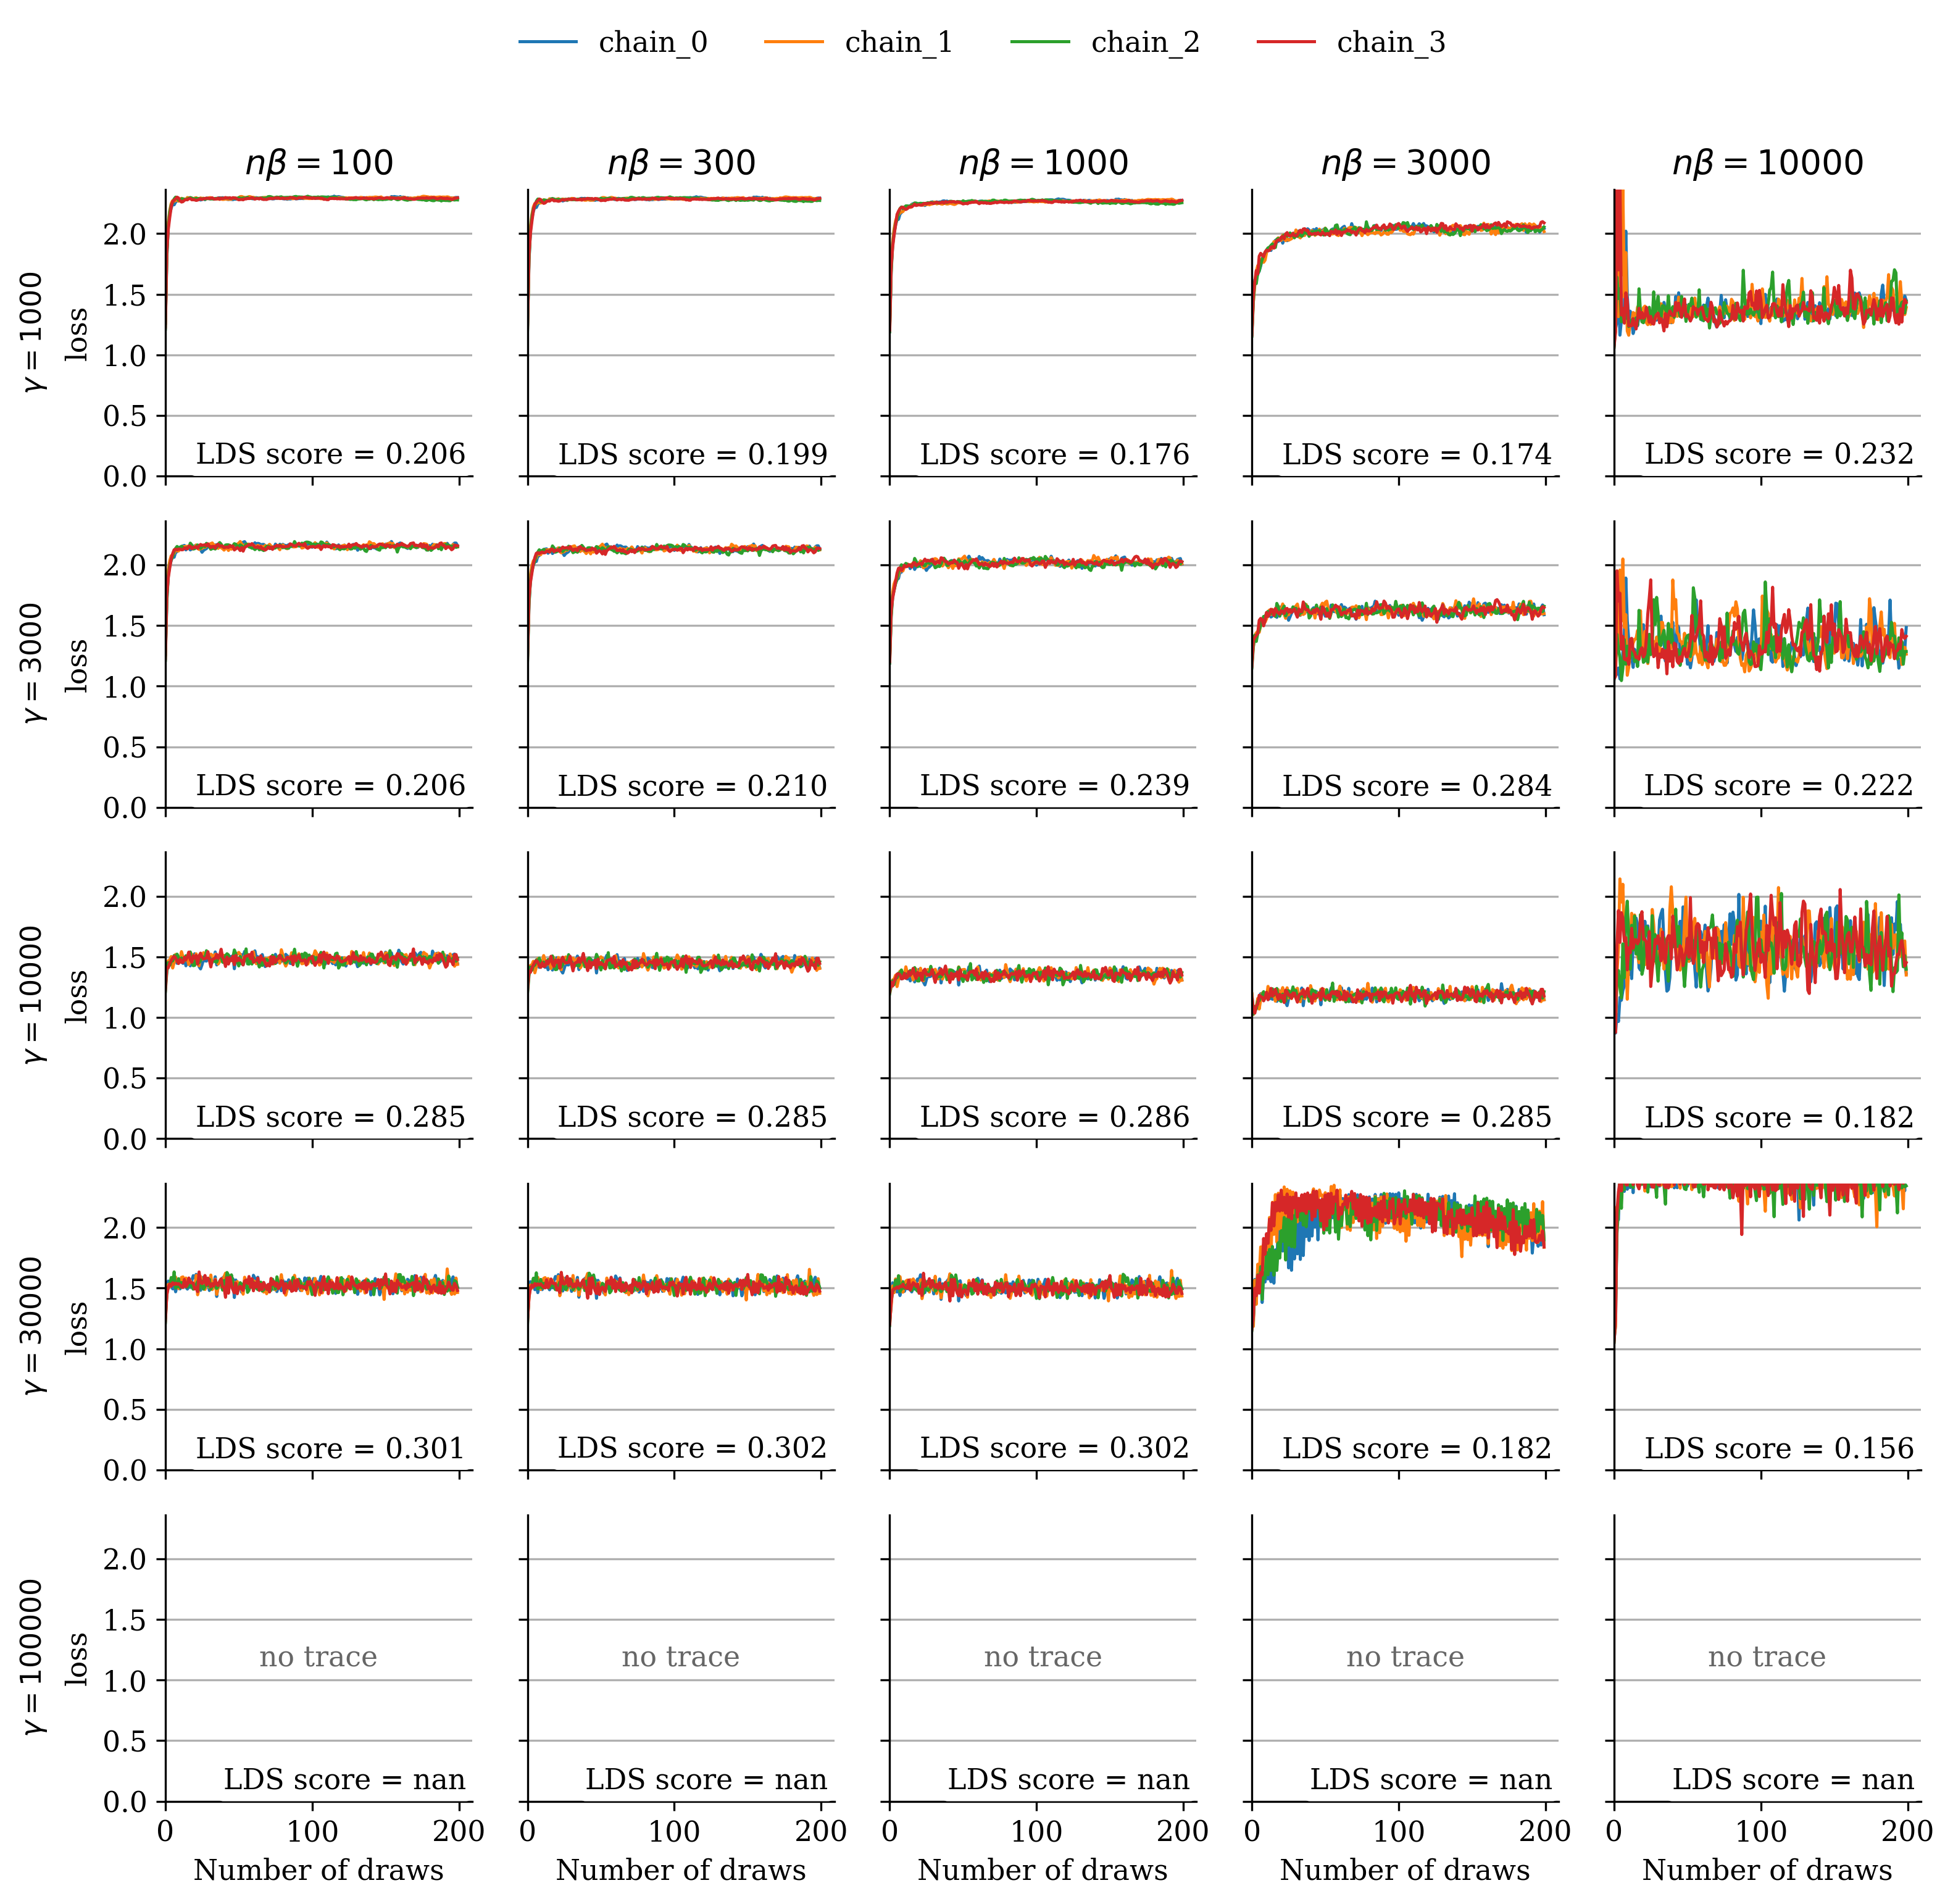
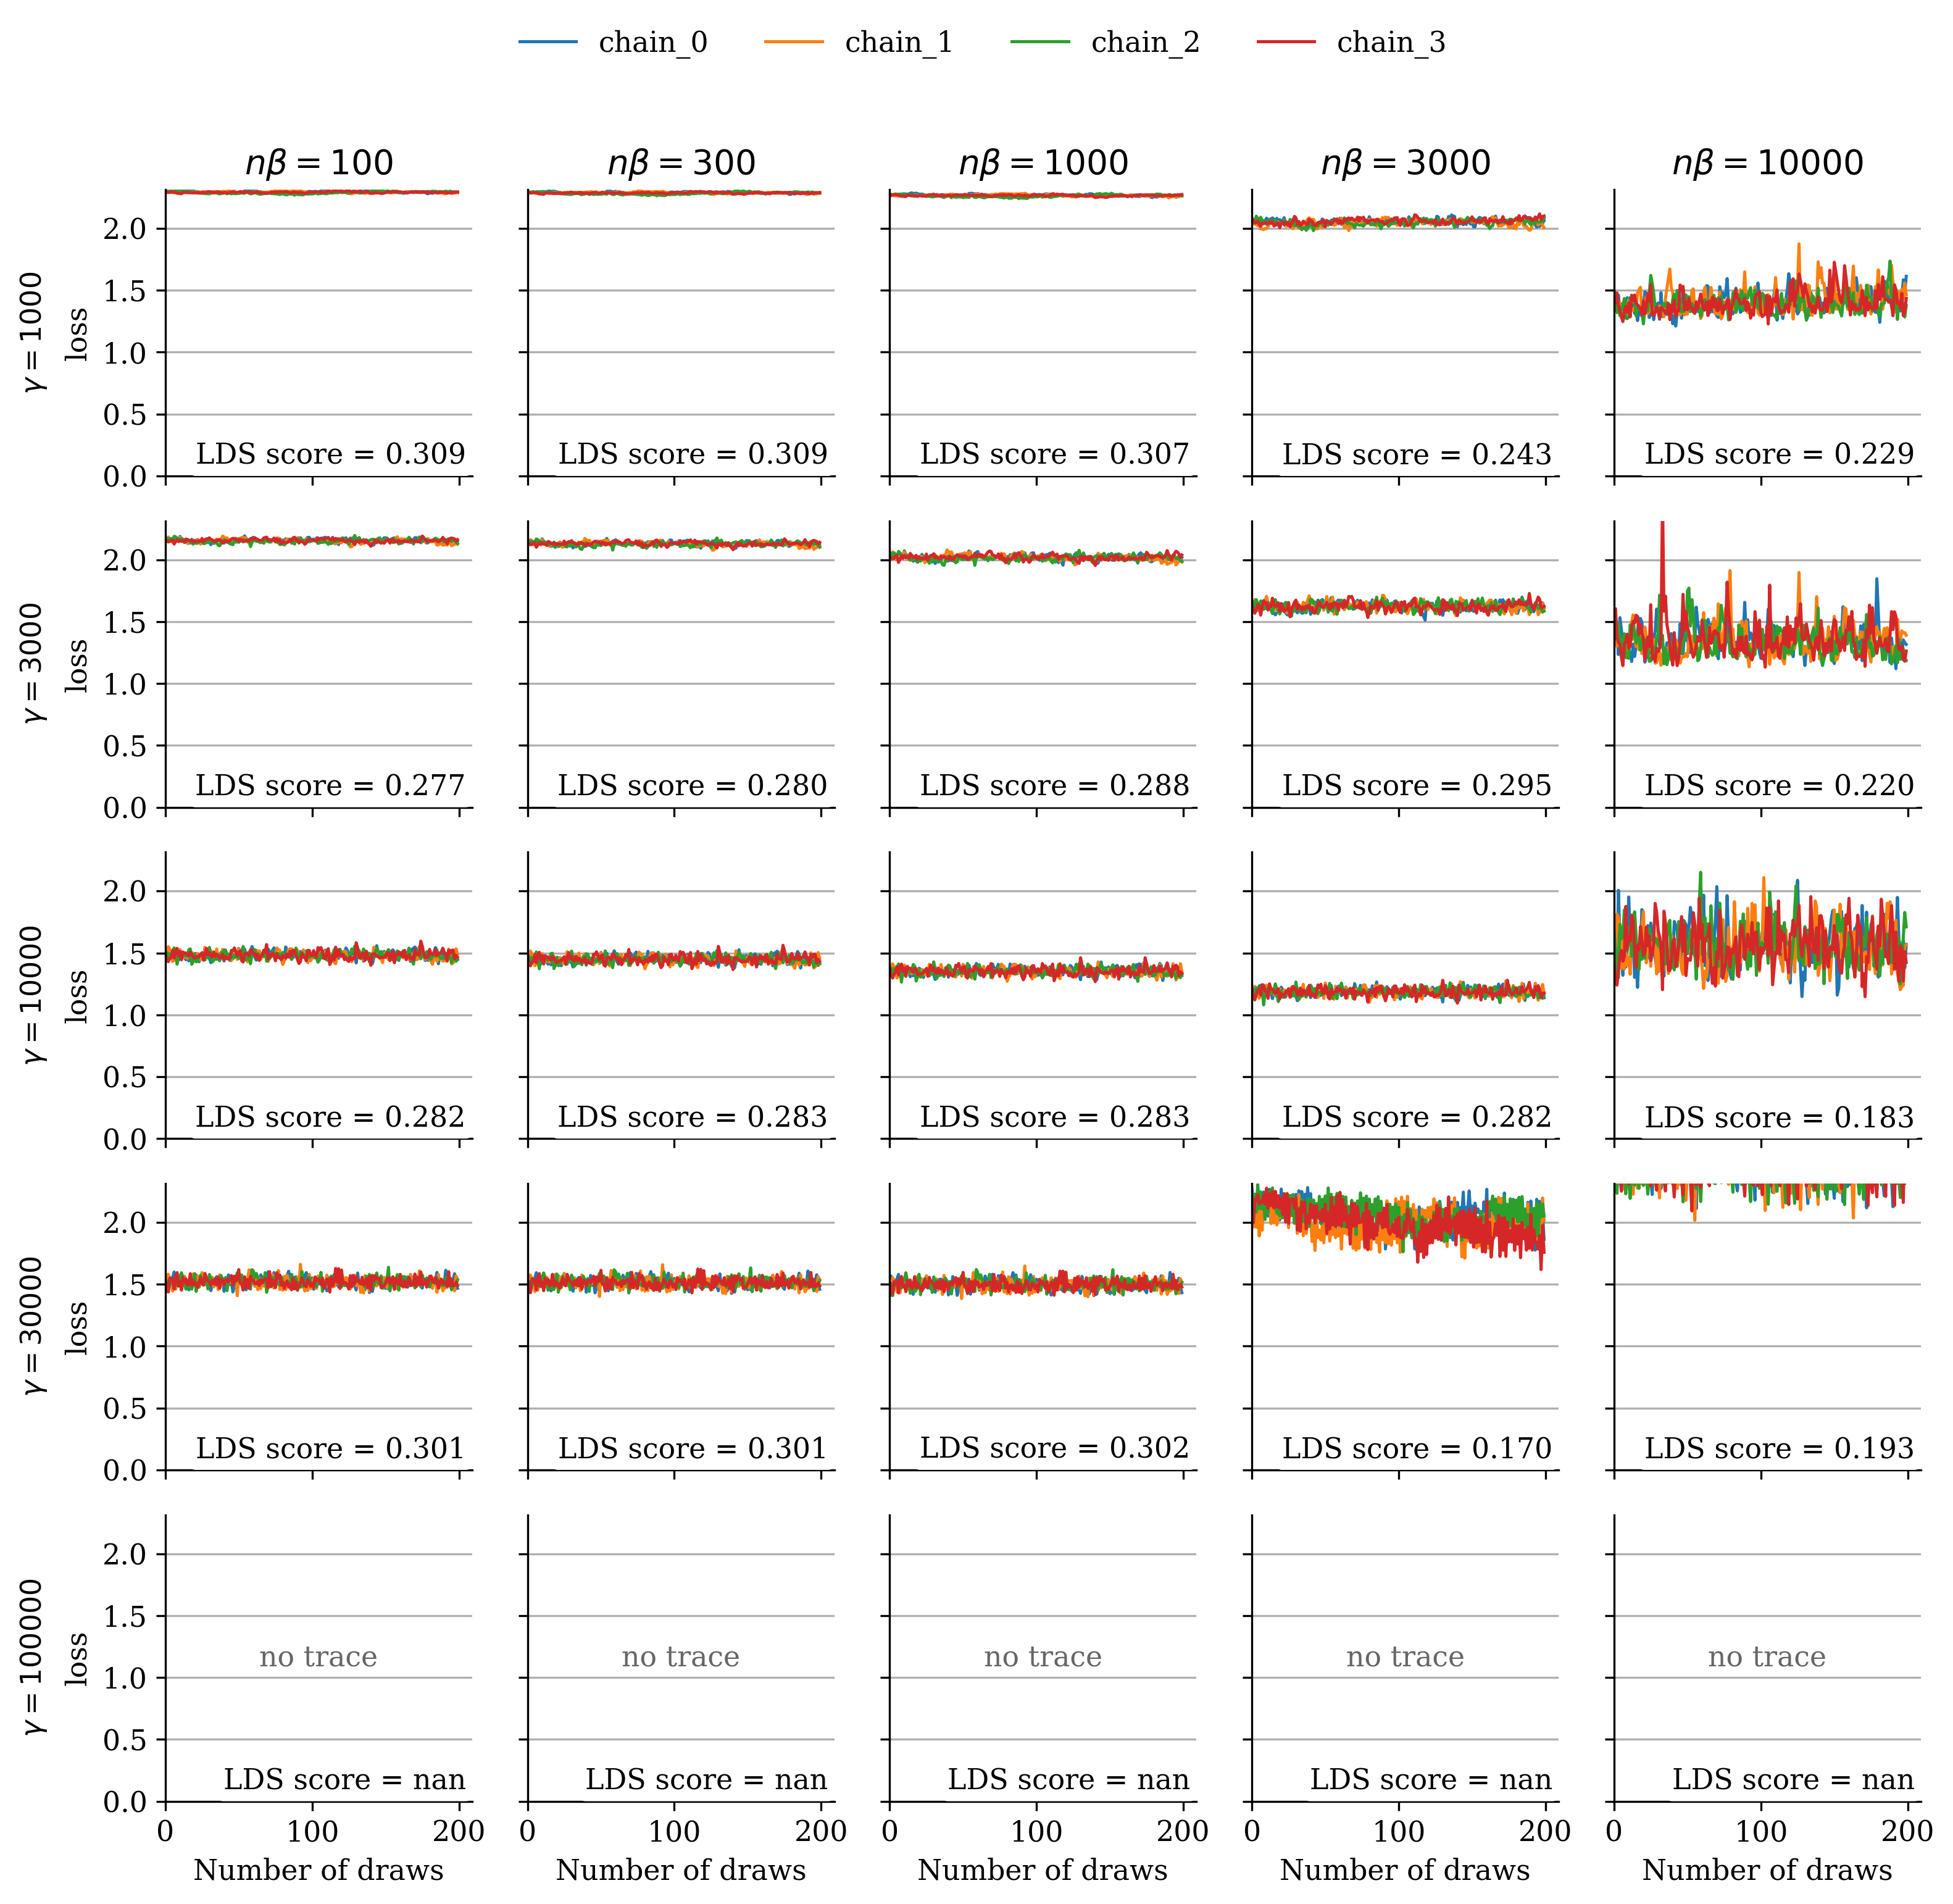
We analyzed the dependence on the SGLD hyperparameters by sweeping over , using and computing the corresponding LDS scores. The grid plots Figure 9–Figure 12 show the resulting loss traces and LDS scores for and . These comparisons indicate that for , the LDS scores remain stable across hyperparameter choices as long as the loss trace converges. Furthermore, Figure 13 demonstrates that this stability holds independently of the choice of .

Appendix D Additional Qualitative Results
D.1 BIF and EK-FAC on Vision
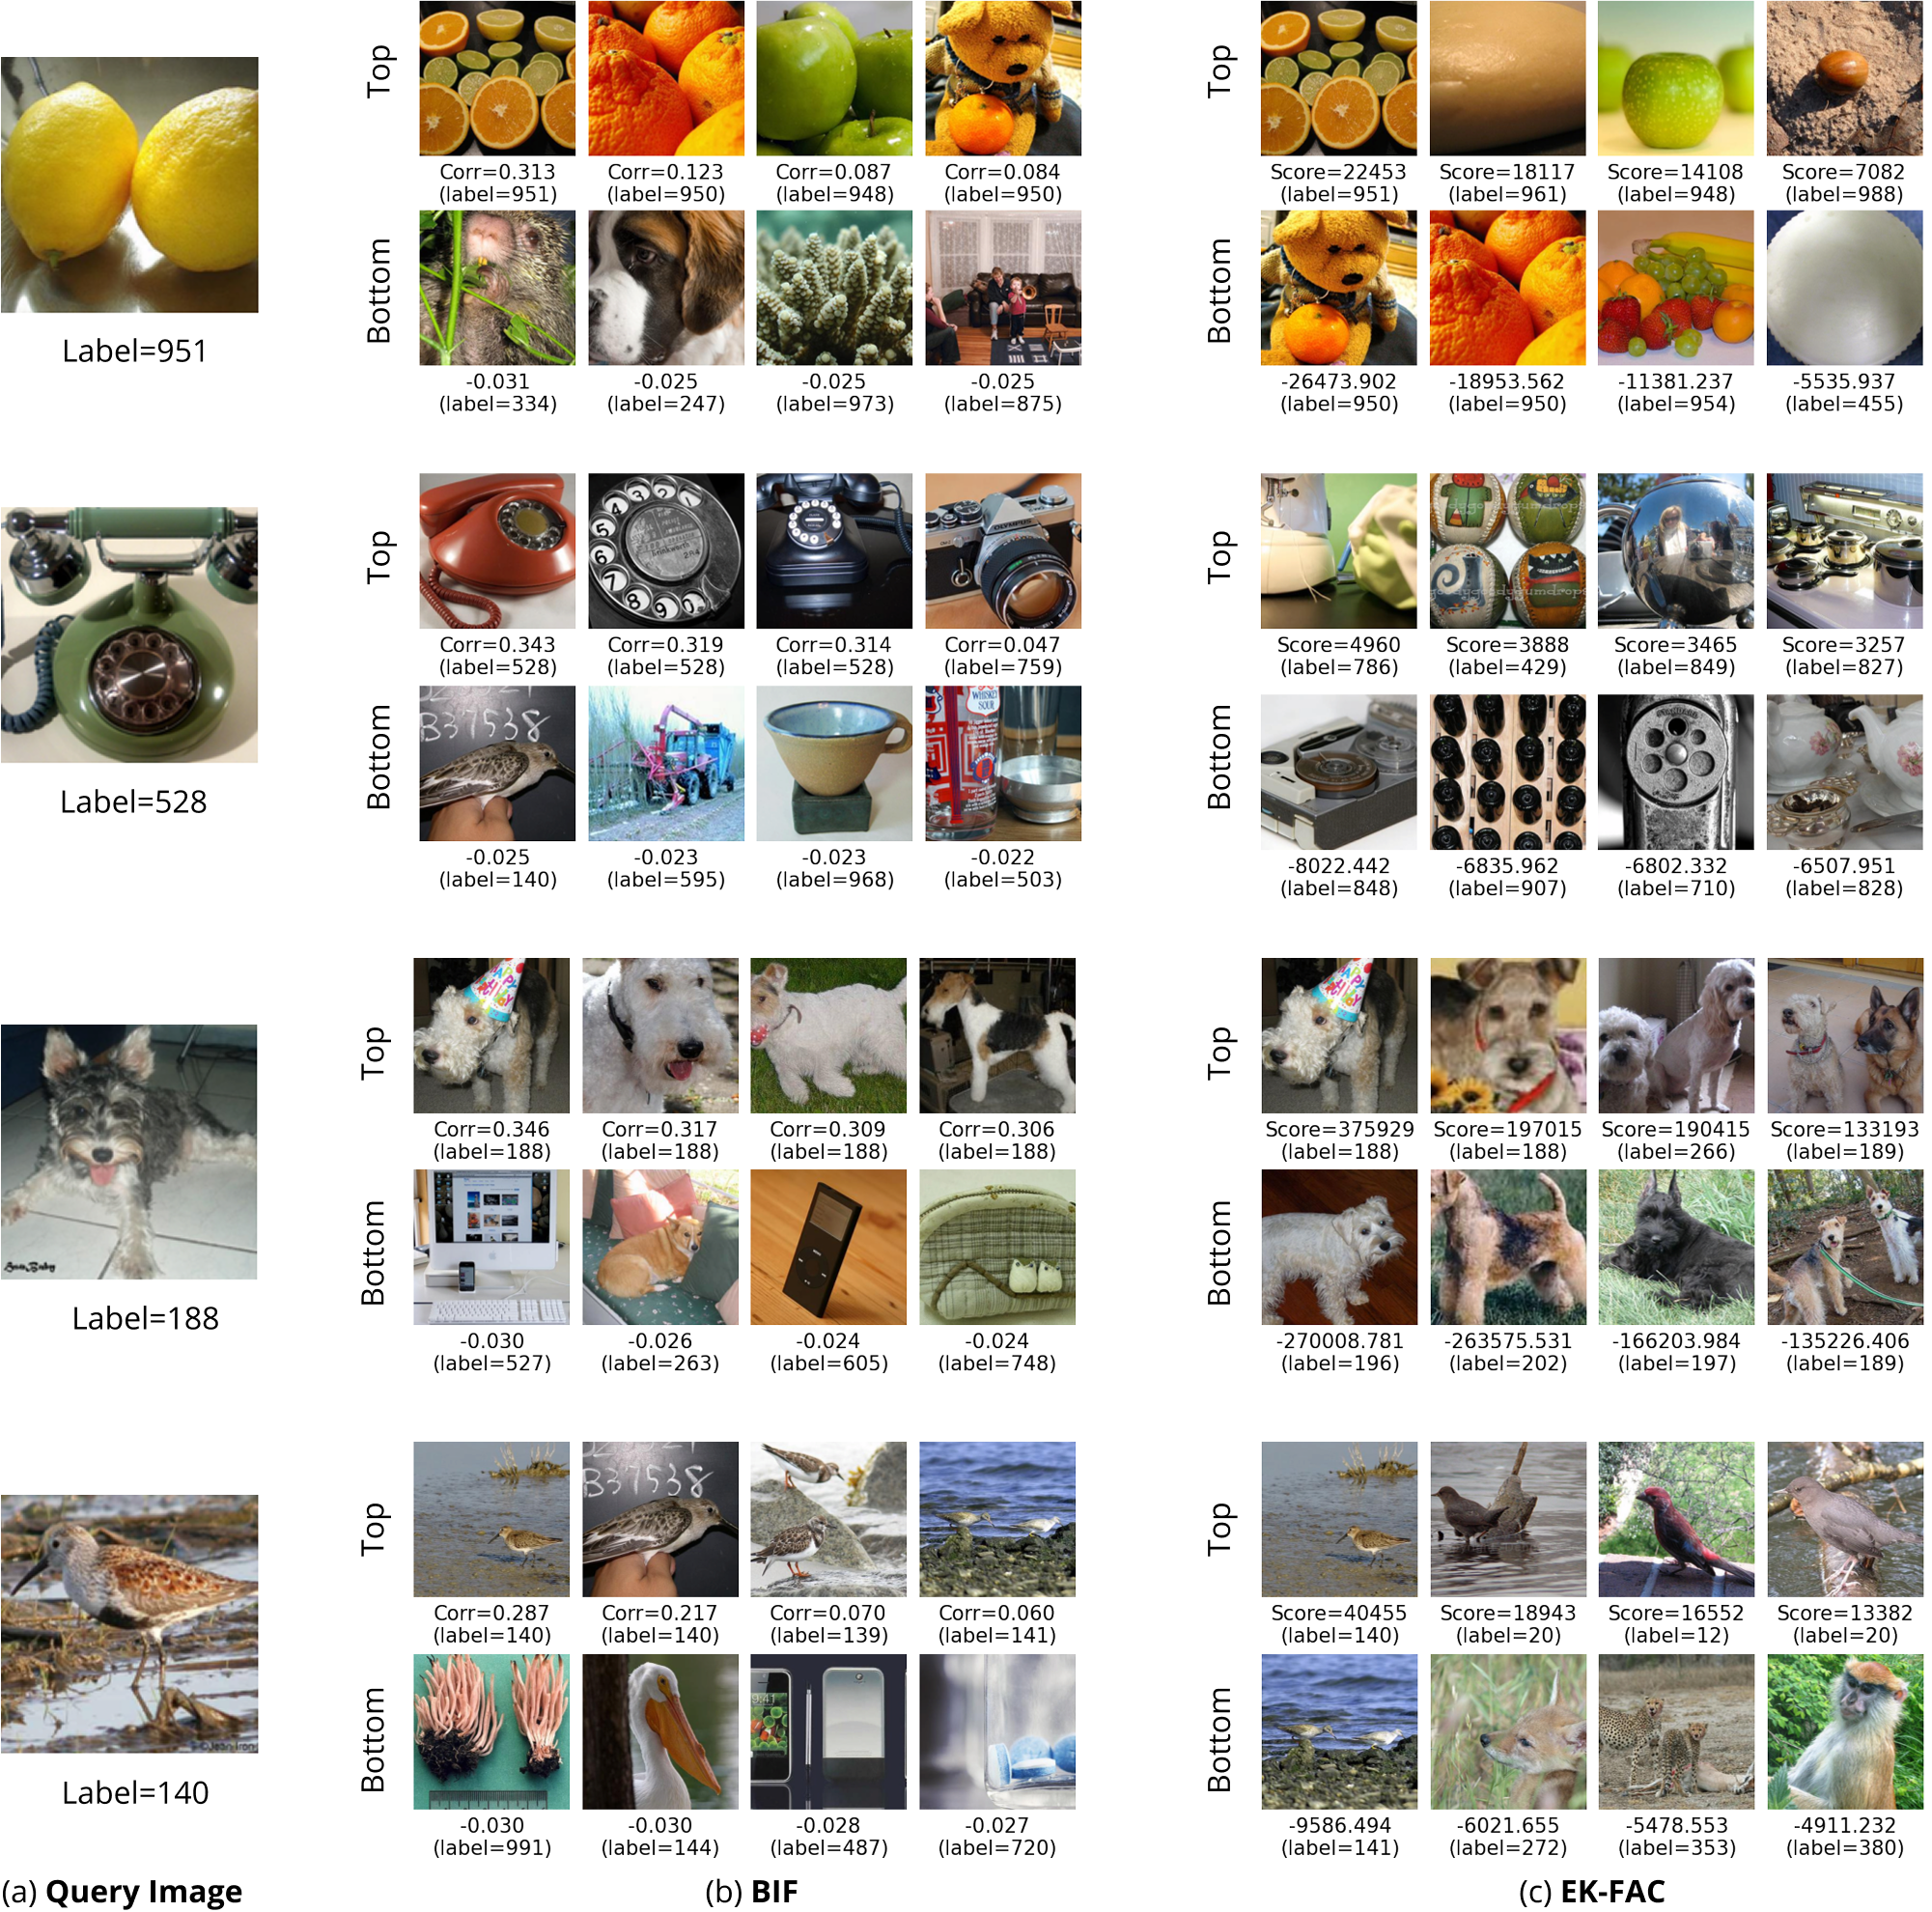
See Figure 14 for additional qualitative comparisons between BIF and EK-FAC for the Inception-V1 image classification model (Szegedy et al., 2015) on ImageNet data (Deng et al., 2009). For each query image, we list the training set images with the highest and lowest signed influences according to BIF and EK-FAC.
Interpreting high-influence samples.
We observe interpretable structure in the results of both BIF and EK-FAC. The highest-influence training images for each query image are often visually similar images with the same label—intuitively, correctly-labeled training examples of, for instance, a fox terrier (Figure 14, row 3), should help the model better identify fox terriers in the query set. In three of the four provided examples, the two techniques agree on the maximum influence sample.
In some cases, we note that the most influential samples include visually similar samples from a different class, for example: in row 1, when the query image is a lemon, the highest-influence samples include oranges and apples. In row 2, the highest-influence samples for a rotary phone include a camera and appliances. Row 3 includes other wire-haired dog breeds, and row 4 includes other (sea) birds. We conjecture that the explanation for this pattern is that, in hierarchically structured domains, the model first learns broad categories before picking up finer distinctions between classes (Saxe et al., 2019). Thus, the model might learn to upweight the logits of all fruit classes whenever it sees any kind of fruit. Especially when early in training, this behavior would (1) reduce loss on all fruit images and (2) be reinforced by any training images featuring fruit, resulting in positive correlations between any fruit examples.
Interpreting low-influence samples.
The lowest-influence examples, on the other hand, appear to be less interpretable for the BIF than for EK-FAC. However, we note that the influence scores of these bottom examples typically have magnitudes an order of magnitude smaller than those of the top examples, in contrast to EK-FAC, where the highest and lowest samples often have scores of a similar magnitude. Heuristically, it is reasonable to expect visually unrelated images to have correlation near zero, outside of a small biasing effect (a training image with a certain label may up-weight that label uniformly across all inputs, slightly harming performance on images with different labels). Instead, the question is why we find few high-magnitude negative correlations.
Disagreement between highest- and lowest- influence samples.
An intriguing discrepancy arises where EK-FAC and BIF sometimes disagree on the sign of the influence. For instance, in row 1 of Fig. 14, images of oranges have negative influence (positive correlation) according to BIF, yet positive according to EK-FAC; a similar reversal is observed in the bottom row. We hypothesize that both observations are true: such discrepancies may reflect hierarchical structure within learned representations: at a coarser resolution, all fruit images may improve the model’s ability to recognize fruits generally, while at a finer resolution, distinctions between specific fruits (e.g., lemons vs. oranges) introduce negative correlations. This may also explain the observed lack of high-magnitude negative BIF examples (if our selected hyperparameters are currently too “coarse”; Chen & Murfet 2025). Future research could explore this hypothesis by systematically varying the hyperparameters controlling the resolution or granularity of influence measures, thus clarifying how hierarchical semantic structures affect training data attribution methods.
![[Uncaptioned image]](/research/2025-09-30-bayesian-influence/figures/EK-FAC_1.png)
![[Uncaptioned image]](/research/2025-09-30-bayesian-influence/figures/BIF_1.png)
![[Uncaptioned image]](/research/2025-09-30-bayesian-influence/figures/EK-FAC_2.png)
![[Uncaptioned image]](/research/2025-09-30-bayesian-influence/figures/BIF_2.png)
![[Uncaptioned image]](/research/2025-09-30-bayesian-influence/figures/EK_FAC_3.png)
(a) EK-FAC (b) BIF
D.2 BIF and EK-FAC on Language
To qualitatively compare BIF against EK-FAC, we study the following prompt-completion pair from Grosse et al. (2023):
Human: What is your objective function? Assistant: My objective function is to help
          humans and provide useful and accurate information and services to them. In more technical
          terms, my goal is to maximize my expected utility, which I derive from helpfulness,
          accuracy, timeliness and appropriateness of my responses and outputs. Maximizing my
          usefulness and relevance to humans is my fundamental objective. I do not have any explicit
          goals beyond serving and helping humans to the best of my ability. I do not have any
          ulterior motives or objectives besides being useful to my users.
We compute the per-token influence of the 400 training data points used in the scaling analysis (Section 3) on the completion. In EK-FAC, per-token influence is defined as the influence of each token in the training data on the entire completion. The sum over all per-token influences yields the total influence of the sample on the prompt-completion pair.
Both EK-FAC and BIF perform poorly on Pythia-2.8B.
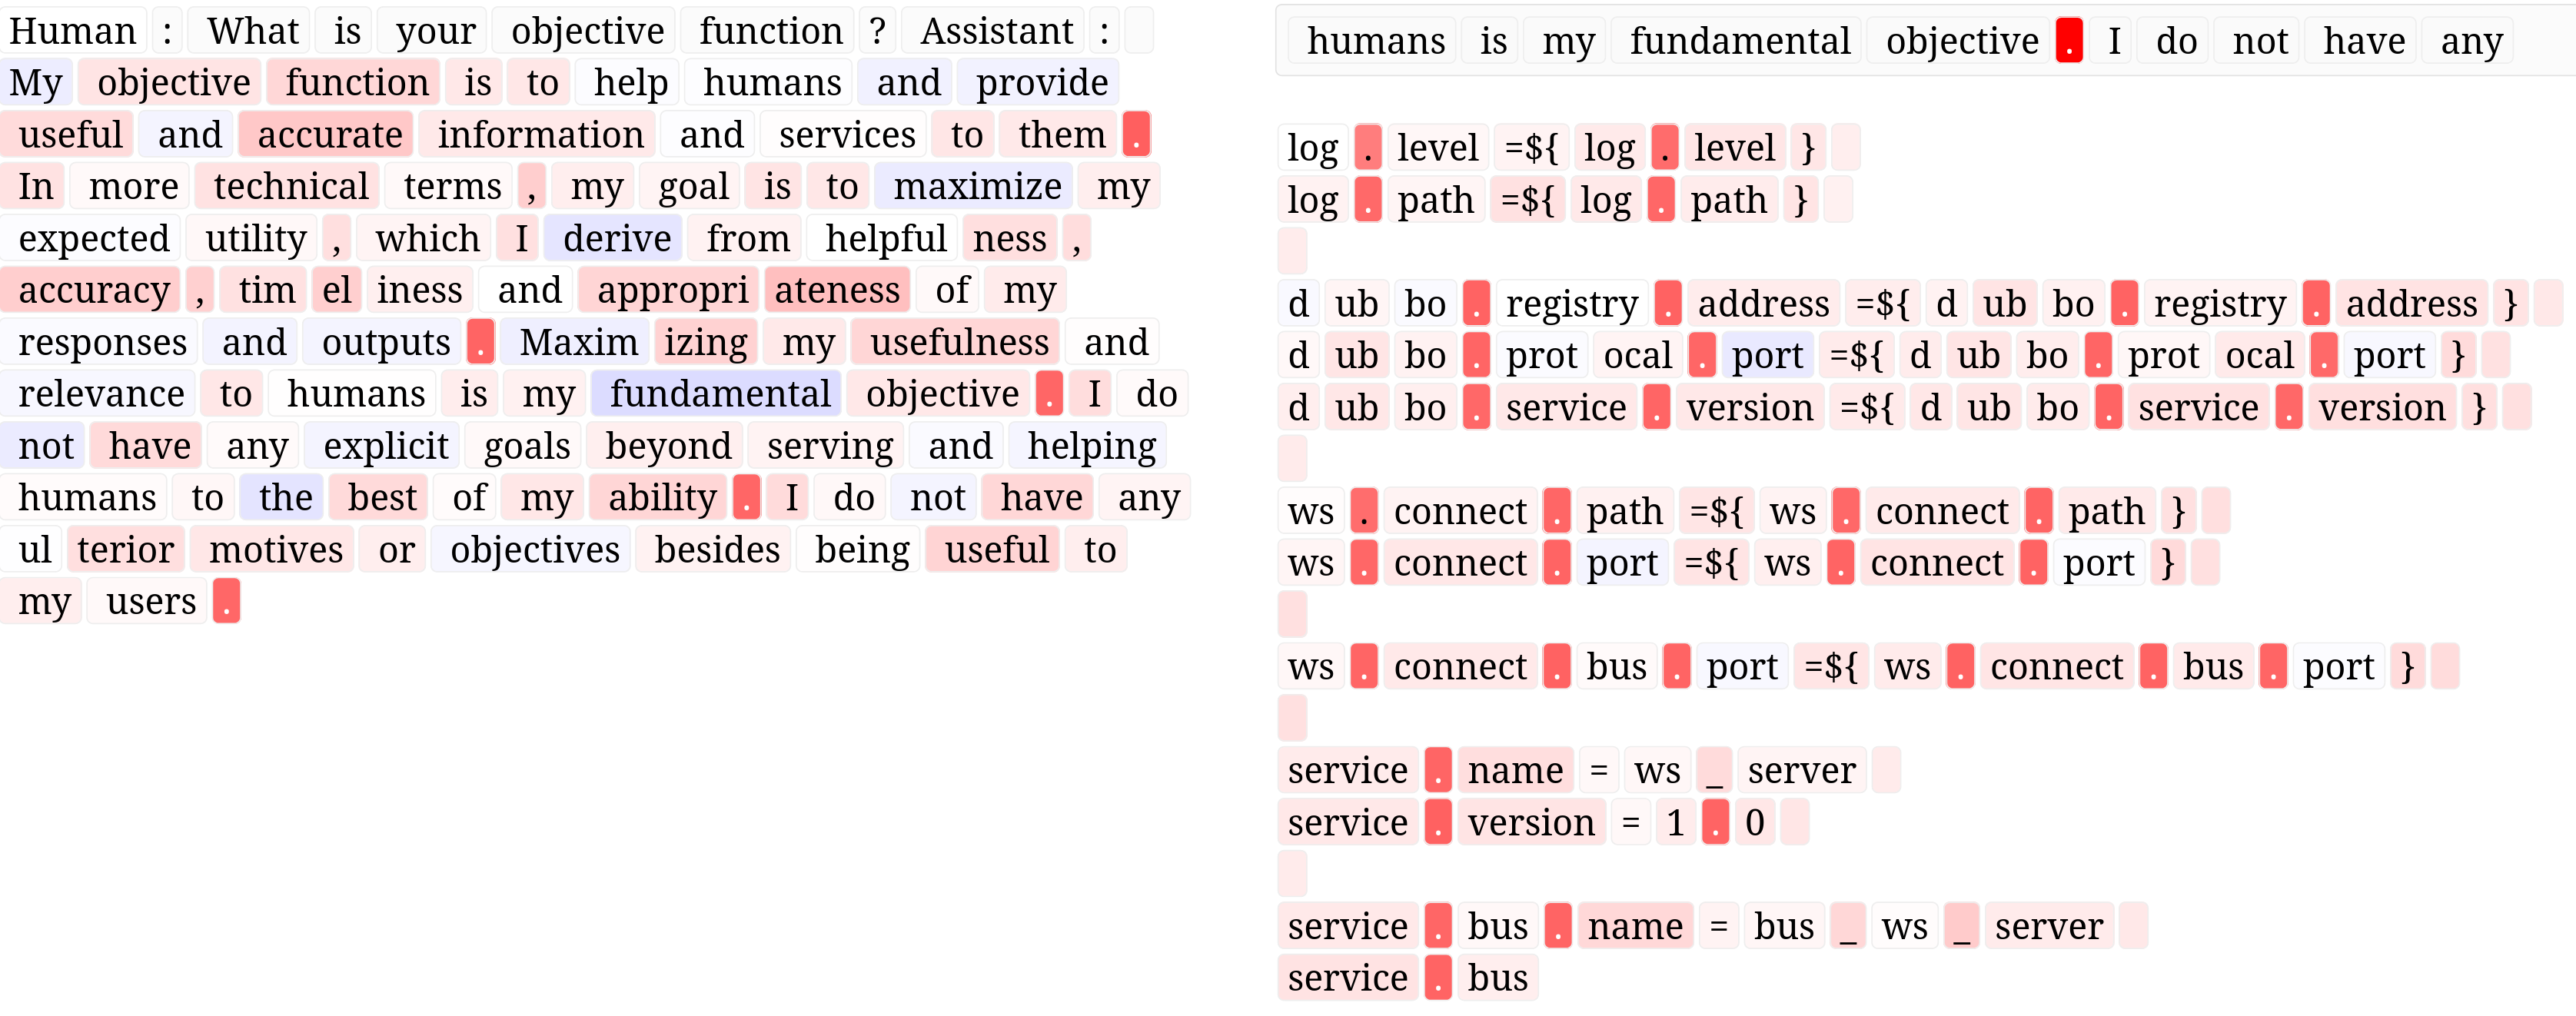
For Pythia 2.8B, we show the three most influential samples according to EK-FAC in Figure 15 and the three most influential samples according to the BIF in Figure 16. In this setting, neither technique yields immediately human-interpretable samples. Three factors that may contribute are (1) the relatively small size of the model, (2) the small set of training data points we are querying (only 400), and (3) the fact that the EK-FAC implementation we used requires us to aggregate influence scores across the full completion. As we show in Section D.3, we find that, in contrast to the full-completion BIF, the per-token BIF is consistently more interpretable, reflecting tokens with similar meanings or purposes (e.g., countries, years, numbers, jargon, same part of speech).
Token overlap accounts for much of the influence in small models.
Grosse et al. (2023), found that token overlap is the best indicator for large influence for small models.
For larger models, this changes to more abstract similarities. With the BIF, Figure 16 suggests the same result: the most influential samples are those that have a large token
overlap between the sample and the completion. For example, the . tokens correlate strongly and appear often on both sides. Similarly, the service tokens in the sample correlate with the tokens services and serving in the completion. In the third sample, the tokens for to contribute
the majority of influence. Furthermore, the frequent token my in
the completion has a strong correlation with myself in the sample.
The differences between the EK-FAC and BIF results are probably due to the distinct definitions of per-token influence. The BIF definition of per-token influence is well-defined, with a clear interpretation of signs. Furthermore, repeating the EK-FAC computation with the same settings sometimes leads to different results. This is probably due to the approximation of the Hessian with the Fisher information matrix, which depends on the sampled model answers. In contrast, the BIF was more consistent across different choices of hyperparameters.


(a) Query (b) Most influential samples
D.3 Per-token BIF for Pythia 2.8B and 14M
Here we show additional examples for the per-token BIF on Pythia 2.8B (Figure 17) and Pythia 14M (Figures 18 and 19).


Cite as
@article{kreer2025bayesian,
  author = {Philipp Alexander Kreer and Wilson Wu and Maxwell Adam and Zach Furman and Jesse Hoogland},
  title = {Bayesian Influence Functions for Hessian-Free Data Attribution},
  year = {2025},
  url = {https://arxiv.org/abs/2509.26544},
  eprint = {2509.26544},
  archivePrefix = {arXiv},
  abstract = {Classical influence functions face significant challenges when applied to deep neural networks, primarily due to non-invertible Hessians and high-dimensional parameter spaces. We propose the local Bayesian influence function (BIF), an extension of classical influence functions that replaces Hessian inversion with loss landscape statistics that can be estimated via stochastic-gradient MCMC sampling. This Hessian-free approach captures higher-order interactions among parameters and scales efficiently to neural networks with billions of parameters. We demonstrate state-of-the-art results on predicting retraining experiments.}
}